
Practice on Solutions to Systems of Linear Inequalities in Two Variables
Loading the math board and drawing, please wait…
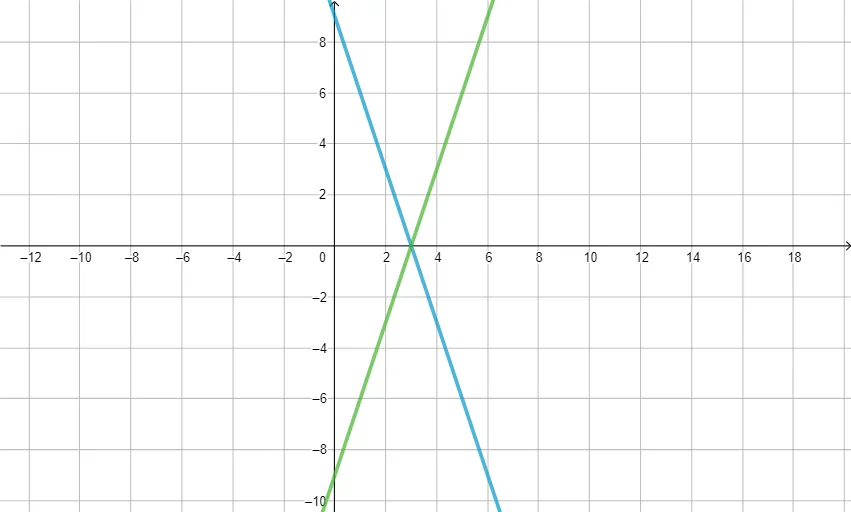
This example demonstrates how to use GeoGebra to draw the solution set of a system of linear inequalities in two variables. Key mathematical concepts include linear inequalities and region representation. Commands used include Line, If, etc. Suitable for middle school mathematics education.
GeoGebra Commands & Parameters
Line(B, A) → fLine(C, D) → gIf(x(C) ≟ x(D), x > x(C), If[x(C) > x(D), (Slope[g] * x) - y + g(0) > 0, (Slope[g] * x) - y + g(0) < 0]) → aIf(x(C) ≟ x(D), x < x(C), If[x(C) < x(D), (Slope[g] * x) - y + g(0) > 0, (Slope[g] * x) - y + g(0) < 0]) → dLine(E, F) → hIf(x(E) ≟ x(F), x > x(E), If[x(E) > x(F), (Slope[h] * x) - y + h(0) > 0, (Slope[h] * x) - y + h(0) < 0]) → bIf(x(E) ≟ x(F), x < x(E), If[x(E) < x(F), (Slope[h] * x) - y + h(0) > 0, (Slope[h] * x) - y + h(0) < 0]) → c
AI Drawing Prompt Reference
Draw a coordinate plane with three lines, each defined by two points. For each line, shade one of the two half-planes based on the relative x-coordinates of its defining points: if the x-coordinates are equal, shade the region to the left or right; otherwise, choose the side where a linear inequality involving the line's slope and intercept holds. The intersection of the three shaded regions represents the solution set, with each region distinguished by color or transparency.
The prompt above was compiled from the original drawing commands and is for reference only.