
Practice: End Behavior of Quadratic Functions (Part 2)
Loading the math board and drawing, please wait…
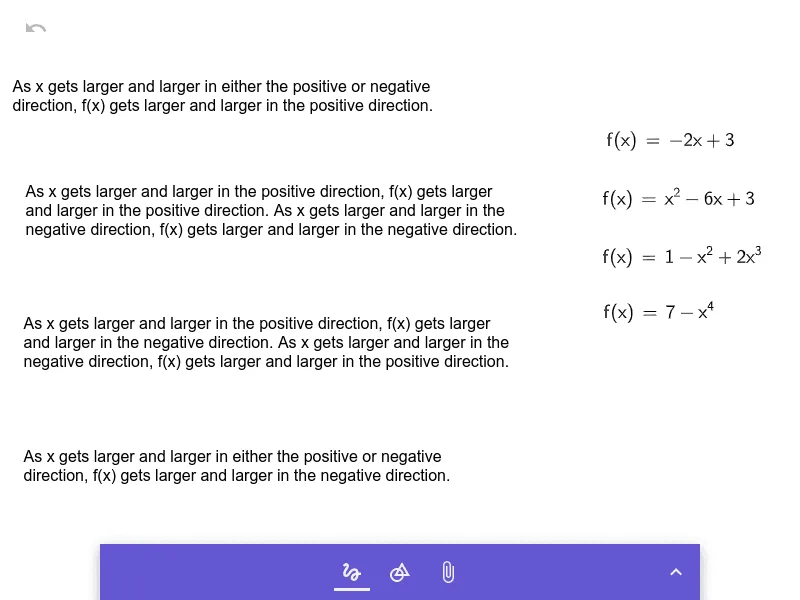
This example demonstrates the end behavior of quadratic functions, involving key mathematical concepts such as function graphs and their endpoint behaviors. By adjusting parameters a, b, c, d, e, f, g, h, one can observe the effects of different coefficients on the function graph. Suitable for high school mathematics education and learning.
GeoGebra Commands & Parameters
Inlinetext aInlinetext bInlinetext cInlinetext dFormula eFormula fFormula gFormula h
AI Drawing Prompt Reference
Draw a quadratic function graph to illustrate its end behavior. The plot shows a parabola whose opening direction and steepness are controlled by several adjustable coefficients. Next to or below the graph, place text boxes displaying the current values of these coefficients and the corresponding function expression. By adjusting these coefficients, one can observe how the two ends of the parabola (as x approaches positive and negative infinity) change direction, such as pointing upward or downward. The overall layout should be clear for educational demonstration, highlighting the dynamic relationship between the graph and the coefficients.
The prompt above was compiled from the original drawing commands and is for reference only.