
Powers of Complex Numbers: A Visual Exploration
Loading the math board and drawing, please wait…
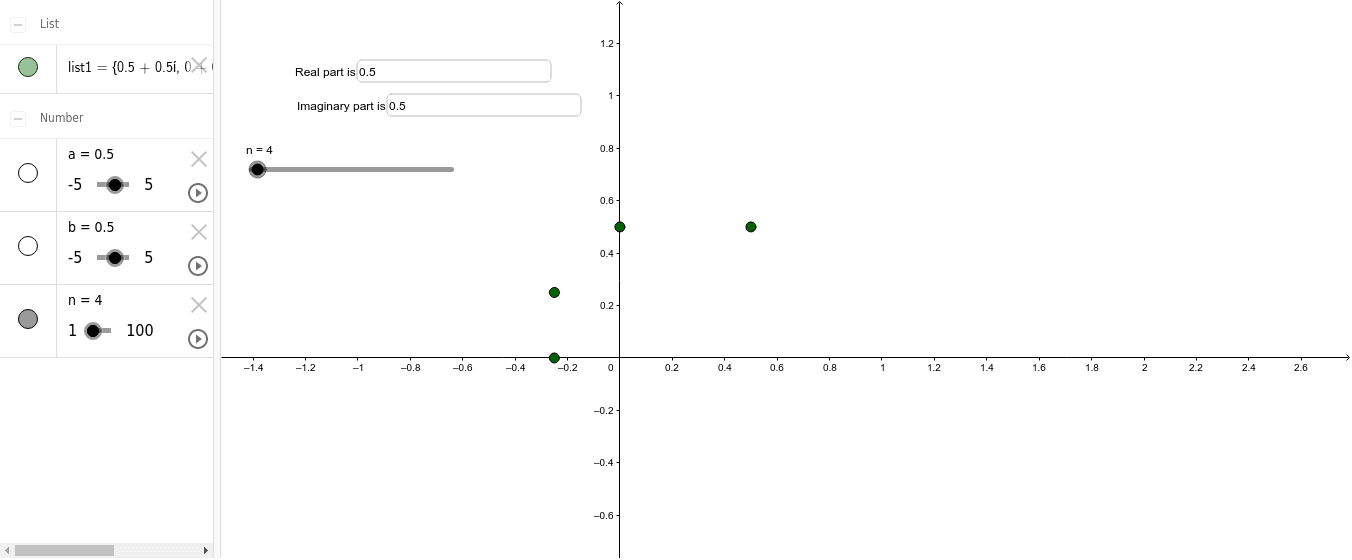
① This GeoGebra example dynamically visualizes integer powers of a complex number in the complex plane, showing how the modulus and argument change with each power. ② Core mathematical concepts include the trigonometric form of complex numbers, De Moivre's theorem (modulus raised to the power, argument multiplied), and the locus of points generated by successive powers. ③ Construction details: Textfield and InputBox9 allow users to input the real part a, imaginary part b, and the exponent n; the Sequence command generates a list1 of powers from 1 to n, which are plotted as points in the complex plane to reveal the pattern of their distribution. ④ Suitable for upper high school or early university students to grasp the geometric meaning of complex powers, and useful for classroom demonstrations or independent student exploration.
GeoGebra Commands & Parameters
Textfield(a) → InputBox8Sequence((a + (b * ί))^(k), k, 1, n, 1) → list1Textfield(b) → InputBox9