
Power Functions y=ax^n Graph (n Positive Odd)
Loading the math board and drawing, please wait…
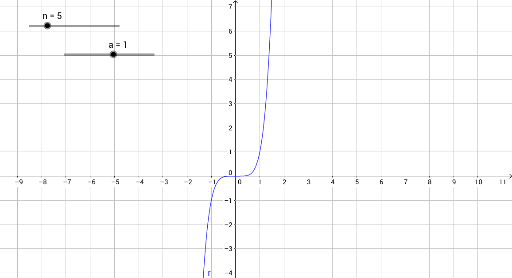
This GeoGebra example demonstrates the graph of power functions y=ax^n where n is a positive odd integer. Key mathematical concepts include power function properties, symmetry about the origin, and the effect of coefficient a on scaling and orientation. Construction involves using variables n, a, and r as sliders in GeoGebra to dynamically adjust parameters and observe real-time changes in the curve across quadrants I and III. Suitable for high school or college students studying algebra and calculus, this tool aids in visualizing how odd exponents influence function behavior and graph shape.
GeoGebra Commands & Parameters
Numeric n(5)Numeric a(1)r(x) = (a * x^(n))