
Power Function Graph y=ax²
Loading the math board and drawing, please wait…
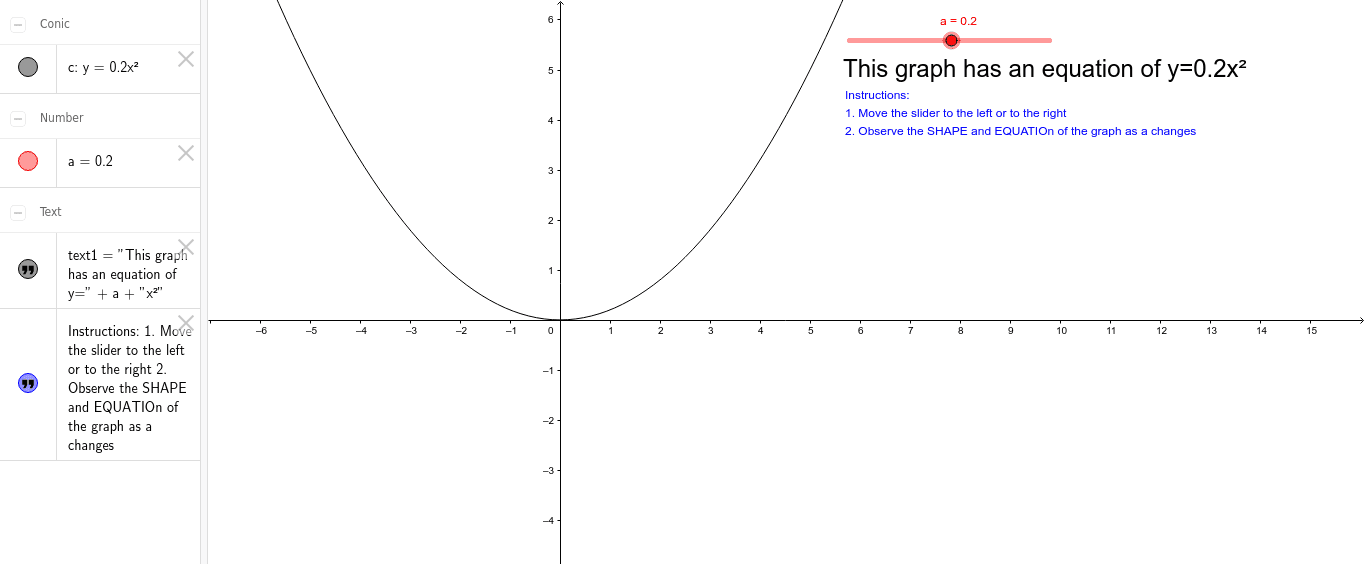
This example demonstrates the graph of the power function y=ax². It involves the core mathematical concept of the properties of power functions. By adjusting parameter a, you can observe the changes in the graph. The construction summary mentions the use of GeoGebra commands a and text1, c and text2. Suitable for high school mathematics education and learning about power function graph transformations.
GeoGebra Commands & Parameters
Numeric a(0.2)y = (x^(2) * a)