
Positive and Negative Numbers: Dynamic Visualization on the Number Line
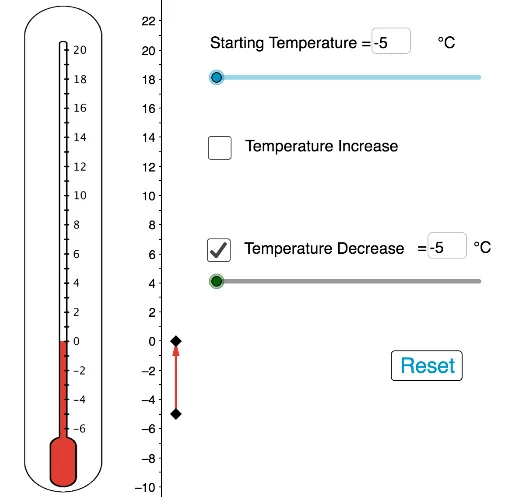
Loading the math board and drawing, please wait…
This GeoGebra example interactively demonstrates the concept of positive and negative numbers using a number line, polygons, and vectors. It visualizes how numbers are positioned relative to zero, their opposites, and absolute values. Core mathematical concepts include the number line, signed numbers, comparison of magnitudes, and basic operations. The construction uses commands such as Midpoint, Polygon, Textfield, Vector, and InputBox to create interactive input fields and dynamic visual feedback. Suitable for middle school mathematics (grades 6-8) to introduce rational numbers, and also useful for elementary students learning negative numbers.
GeoGebra Commands & Parameters
Midpoint(A, B) → GPolygon(C, D, F, E) → poly1, h, d, f, eTextfield(a) → InputBox1Textfield(b) → InputBox2Vector(H, I) → uTextfield(c) → InputBox3
AI Drawing Prompt Reference
Draw a number line to show the positions of positive and negative numbers, use a polygon to represent the absolute values and opposites of these numbers, and create input boxes to dynamically display a vector between points H and I. Start by drawing points A and B on the number line and finding their midpoint G, then use points C, D, F, and E to draw a polygon representing the absolute values and opposites, followed by creating input boxes InputBox1, InputBox2, and InputBox3, and finally drawing vector u between points H and I.
The prompt above was compiled from the original drawing commands and is for reference only.