
Positions on the Number Line by Fractions and Decimals by MABORE LEKALAKALA
Loading the math board and drawing, please wait…
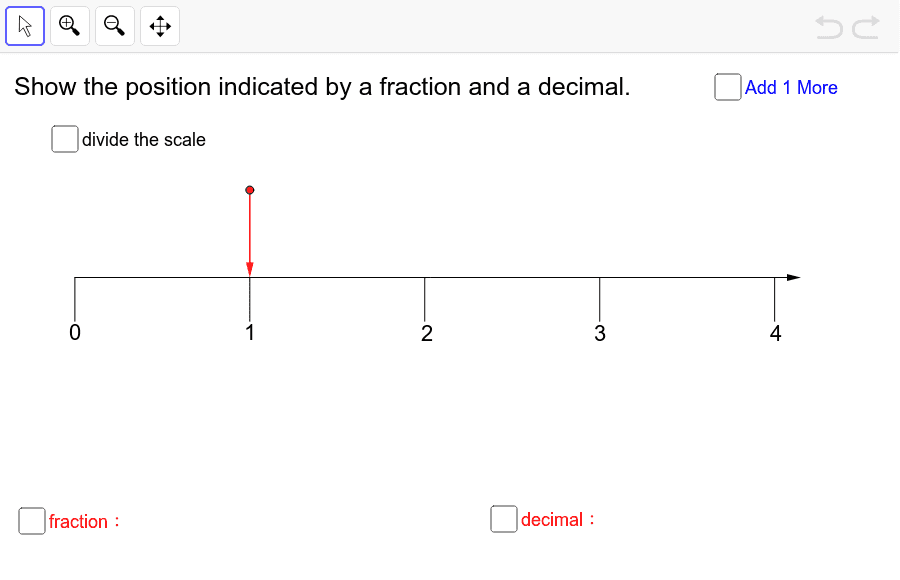
This example demonstrates how to represent fractions and decimals on a number line. Key mathematical concepts include fractions, decimals, coordinate systems, and ratios. Construction involves using GeoGebra commands like Point, Segment, Sequence, and Vector, along with objects such as initialpixelperunit and L to set up the number line. Suitable for middle school students or math teaching tools.
GeoGebra Commands & Parameters
Point(yAxis) → BSegment((0, -0.55), (0, -0.8)) → bSequence(Segment[(i, 0), (i, -1 * 0.25)], i, 0, 4) → list6Sequence(Segment[((2 * i - 1) / 2, 0), ((2 * i - 1) / 2, -1 * 0.2)], i, 1, 4) → list7Sequence(Sequence[Segment[(i / 2 + 0.1 * j, 0), (i / 2 + 0.1 * j, -1 * 0.15)], j, 1, 4], i, 0, 7) → list8Sequence(Sequence[Segment[(i / 20 + 0.01 * j, 0), (i / 20 + 0.01 * j, -1 * 0.06)], j, 1, 4], i, 0, 79) → list9Sequence(Segment[((2 * i - 1) / 20, 0), ((2 * i - 1) / 20, -1 * 0.1)], i, 1, 40) → list10Point(Sequence[(i, L / 2), i, 0, 4, 0.01]) → AVector((0, 0), (4.15, 0)) → aVector(A, (x(A), 0)) → uPoint(Sequence[(i, L / 2), i, 0, 4, 0.01]) → A'Vector(A', (x(A'), 0)) → v
AI Drawing Prompt Reference
Draw a horizontal number line in a coordinate system from -0.8 to 0.8, marking integer positions with short lines below the axis and representing fractions and decimals with points above the axis, such as 0.25, 0.5, etc. Use different lengths of line segments to distinguish various types of markings, and finally draw a vector from the origin to a point at 4.15 units to the right.
The prompt above was compiled from the original drawing commands and is for reference only.