
PositionGraphs: Position Graph Analysis
Loading the math board and drawing, please wait…
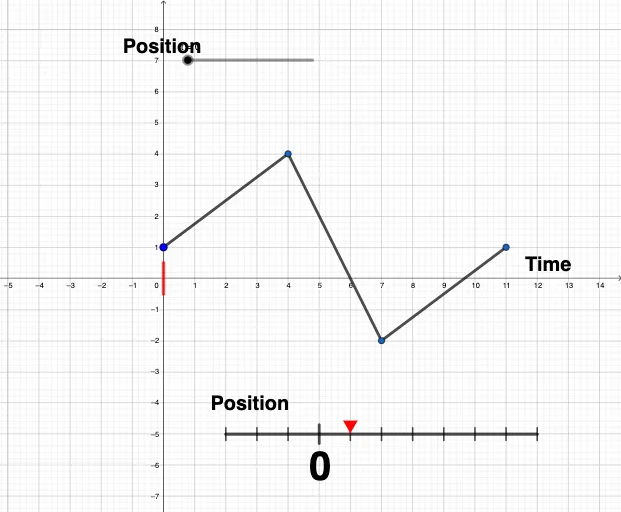
PositionGraphs demonstrates dynamic analysis of position graphs, involving concepts like algebra, difference and slope, dilation, constructions. The construction uses GeoGebra commands such as Point, Line, Segment. Suitable for middle school students learning geometric transformations and function graphing.
GeoGebra Commands & Parameters
Point(yAxis) → ALine(A, B) → fLine(B, C) → hLine(C, D) → iSegment((2, -5), (12, -5)) → jSegment((5, -5.3), (5, -4.7)) → lSegment((t, -0.5), (t, 0.5)) → nSegment((6, -5.2), (6, -4.8)) → pSegment((7, -5.2), (7, -4.8)) → qSegment((8, -5.2), (8, -4.8)) → rSegment((9, -5.2), (9, -4.8)) → sSegment((10, -5.2), (10, -4.8)) → aSegment((11, -5.2), (11, -4.8)) → bSegment((12, -5.2), (12, -4.8)) → cSegment((4, -5.2), (4, -4.8)) → dSegment((3, -5.2), (3, -4.8)) → eSegment((2, -5.2), (2, -4.8)) → f_1
AI Drawing Prompt Reference
Create a coordinate-geometry position-graph style diagram. Draw the vertical y-axis and choose a point on it as the starting point. Connect this point to three other consecutively defined points to form three straight lines: one main line and two connected auxiliary lines. On the horizontal level y = -5, draw a segment from (2, -5) to (12, -5). Near y = -5, add short vertical segments at x = 5, 6, 7, 8, 9, 10, 11, 12, 3, and 4, with endpoints at y = -5.3 and -4.7 for x = 5, and at y = -5.2 and -4.8 for the remaining listed x-values. Also include a parameterized vertical segment from (t, -0.5) to (t, 0.5).
The prompt above was compiled from the original drawing commands and is for reference only.