
Polynomials: Exploring the y-axis Intercept when x=0
Loading the math board and drawing, please wait…
In collections
Quadratic, Parabola
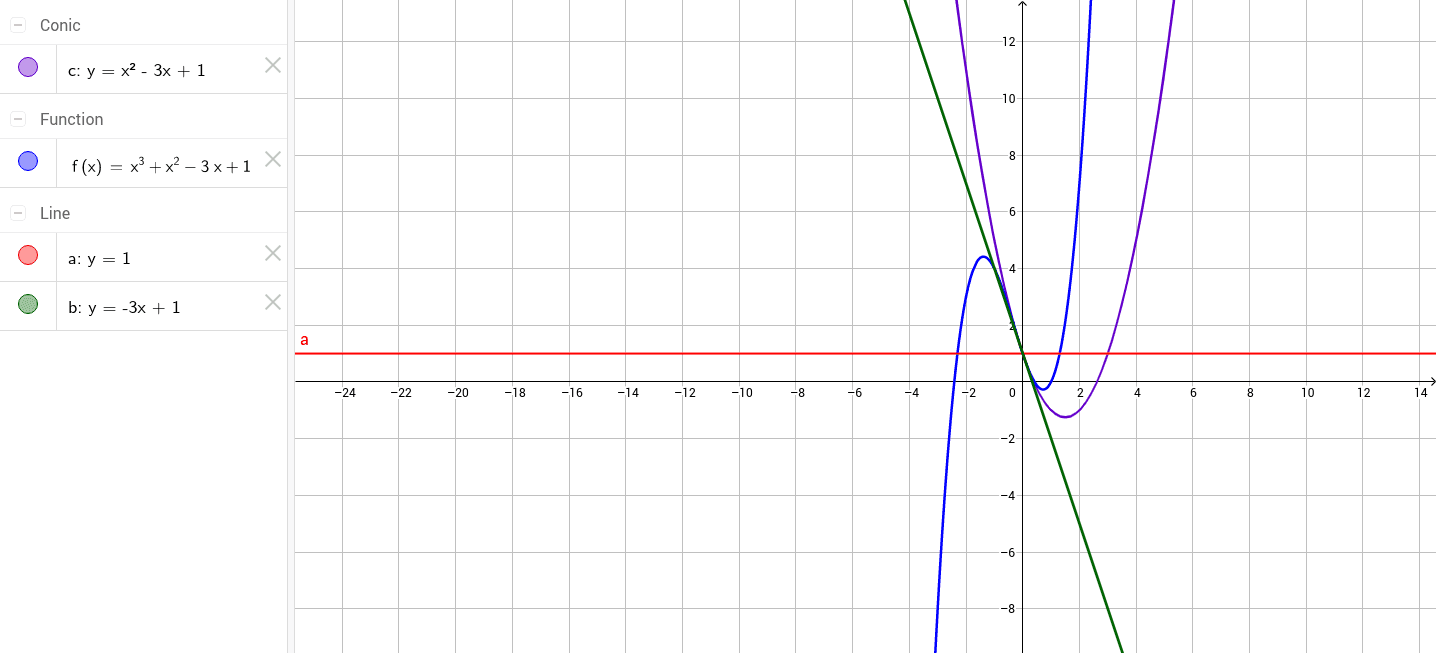
This GeoGebra example dynamically demonstrates the y-axis intercept of a polynomial function, i.e., the value of the function when x=0. The core mathematical concept is the intersection of a function graph with the coordinate axes, polynomial evaluation, and the geometric meaning of the intercept. The construction uses GeoGebra objects a, b, c, and f (likely parameters or function definitions) to define the polynomial f, allowing users to adjust parameters and observe how the intercept changes. Suitable for middle and high school students learning function graphs, coordinate geometry basics, or the connection between algebra and geometry. It is ideal for classroom demonstrations or self-guided exploration, helping learners understand the role of the constant term in the polynomial expression and its visual representation on the graph.
GeoGebra Commands & Parameters
Line a(0, 1, -1)Line b(3, 1, -1)Conic cf(x) = x^(3) + x^(2) - (3 * x) + 1
AI Drawing Prompt Reference
Draw the graph of a cubic polynomial function and display its y-axis intercept. Use two horizontal lines to represent the y-axis and another reference line, and draw a curve passing through the origin to represent the polynomial. Adjust the coefficients of the polynomial to observe the change in the intercept and show the intersection points of the function graph with the coordinate axes.
The prompt above was compiled from the original drawing commands and is for reference only.