
Polynomial Equations & Inequalities
Loading the math board and drawing, please wait…
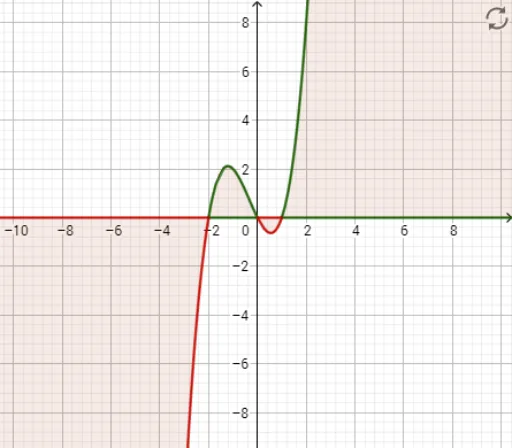
This example demonstrates the graphical solution of polynomial equations and inequalities, highlighting function properties and solution regions. Key mathematical concepts include polynomial functions, equation solving, inequality regions, and integral applications. GeoGebra commands used in construction are IntegralBetween for area calculation, Textfield for displaying text, Polynomial for function plotting, ShadedArea for region visualization, inpF for inputting functions, g for auxiliary graphics, txtExpFac for expression factors, and axis/negAxis for axis settings. Suitable for high school mathematics education, aiding in the intuitive understanding of function characteristics and inequality solution sets.
GeoGebra Commands & Parameters
IntegralBetween(f, 0, -2000, 2000) → ShadedAreaTextfield(f) → inpFPolynomial(f) → g