
Polar Curve Plotter
Loading the math board and drawing, please wait…
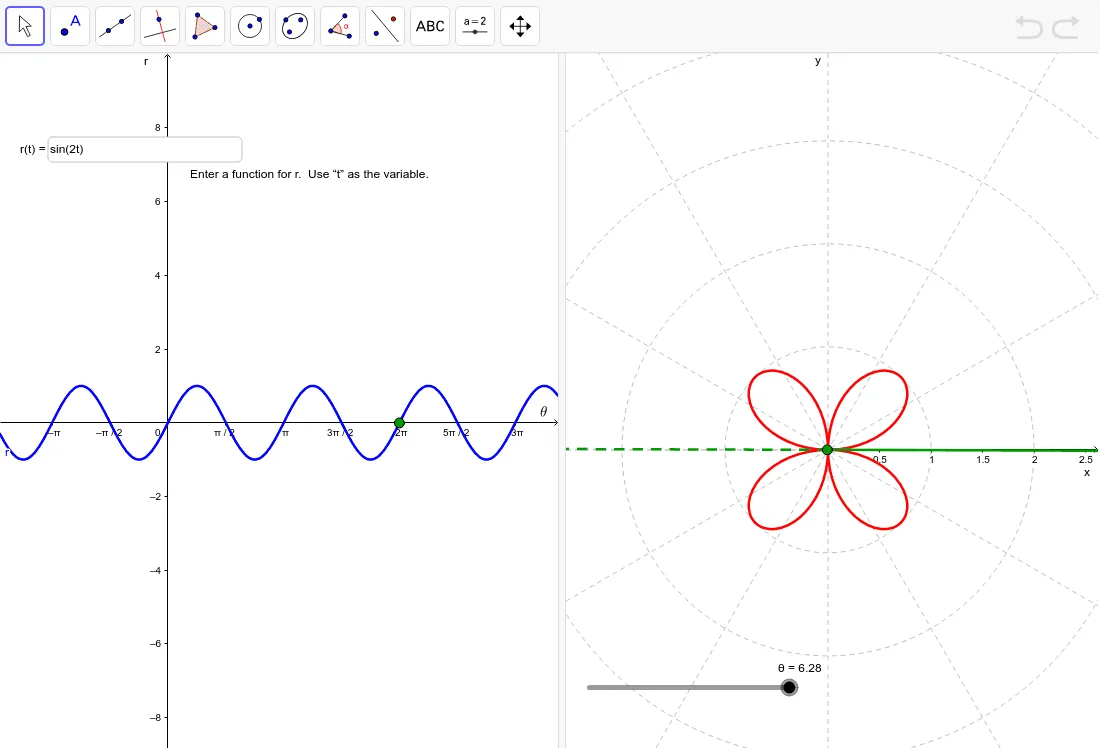
This example demonstrates how to sketch the graph of a polar equation in the Cartesian coordinate system for better visualization. Key math concepts include polar coordinates, function graphing, and calculus. It utilizes GeoGebra commands like CurveCartesian, Ray, Segment, and Textfield. Suitable for high school and above students to learn about the geometric meaning of polar equations and calculus applications.
GeoGebra Commands & Parameters
CurveCartesian((r(t) * cos(t)), (r(t) * sin(t)), t, 0, θ) → aRay((0, 0), (cos(θ), sin(θ))) → posRayRay((0, 0), ((-cos(θ)), (-sin(θ)))) → negRaySegment(onCart, (x(onCart), 0)) → bSegment(onCart, (x(onCart), 0)) → cTextfield(r) → inputBox1