
Poisson Distribution Probability Function Demo
Loading the math board and drawing, please wait…
In collections
ΠΙΘΑΝΟΤΗΤΕΣ
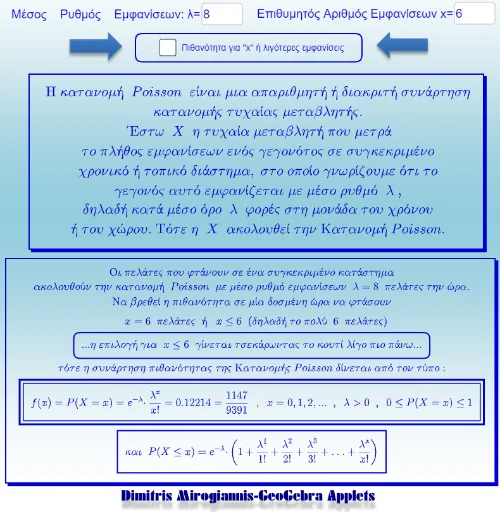
This example demonstrates the Poisson distribution probability function and its variation patterns. Key math concepts include probability & statistics, derivatives, function graphs, and optimization. Construction highlights involve commands like Textfield, Pascal, Poisson, FractionText, Sequence, Random, Gamma, and objects such as λ, ν, χ, P, Εισ1, etc. Suitable for high school and above students to learn Poisson distribution properties.
GeoGebra Commands & Parameters
Textfield(λ) → Εισ1Textfield(χ) → Εισ3Pascal(3, 0.4) → aPoisson(λ, χ, b) → cFractionText(c) → κείμενο1FractionText(λ) → κείμενο4Sequence(cbrt(k), k, 1, 54) → λίστα1Sequence(cbrt(k), k, 1, 24) → λίστα2Random(1, 23) → dGamma(5, 3, 1) → ePoisson(5) → f
AI Drawing Prompt Reference
Draw the Poisson distribution probability function, set parameters λ and χ, use the Poisson command to generate the Poisson distribution, display the probability values with FractionText, generate a sequence of cube roots, and finally use Random and Gamma functions to draw the graph.
The prompt above was compiled from the original drawing commands and is for reference only.