
Poisson Approximation to the Binomial Distribution
Loading the math board and drawing, please wait…
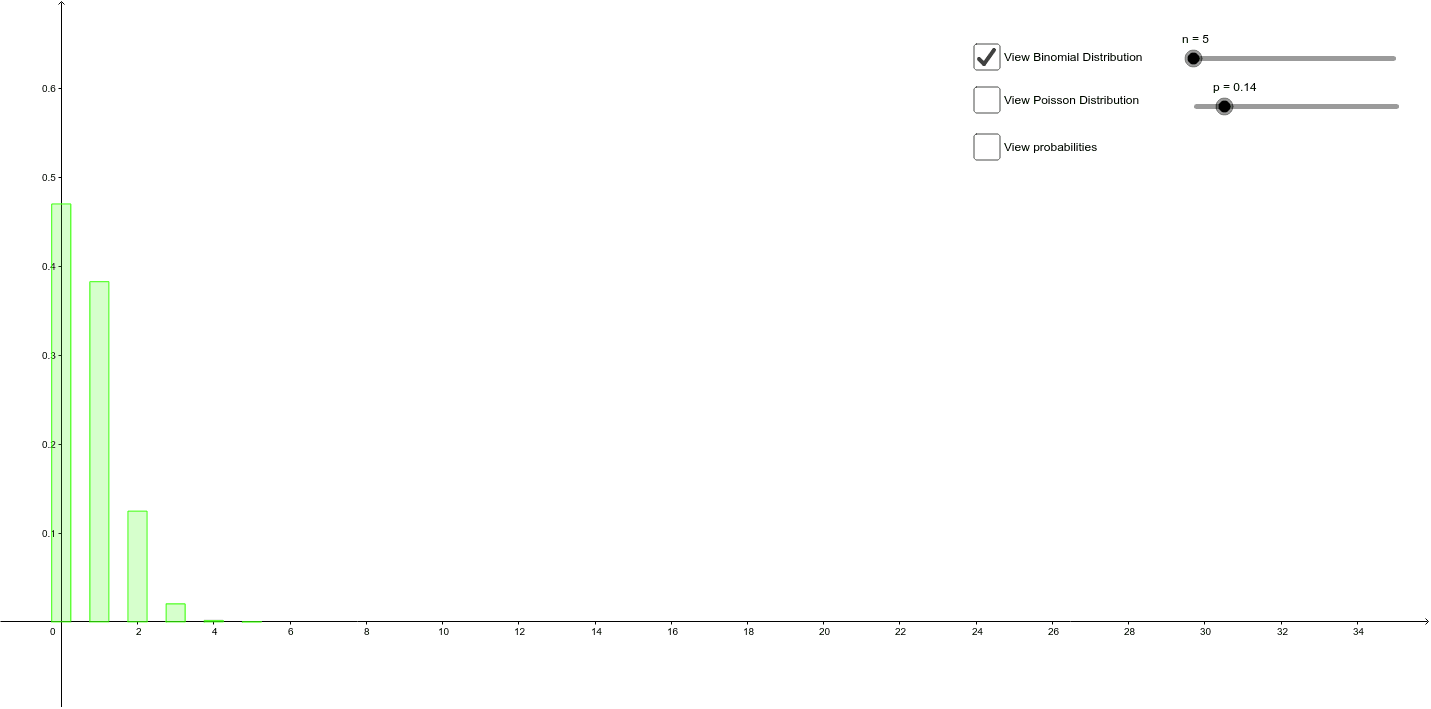
This example demonstrates the graphical phenomenon of how the Poisson distribution approximates the binomial distribution. Core mathematical concepts involved include the binomial distribution, Poisson distribution, and probability & statistics. Construction highlights using GeoGebra commands/objects: Sequence, BarChart, n (trials), p (success probability), xvals (x values), yvalsbin (binomial y values), b (parameter), lambda (Poisson parameter), yvalspoisson (Poisson y values), a, c, d, text1, text2, text3, e. Suitable for high school and above learning probability statistics and distribution approximation.
GeoGebra Commands & Parameters
Sequence(i, i, 0, n) → xvalsSequence(BinomialDist[n, p, xvals(i), false], i, 1, n + 1) → yvalsbinBarChart(xvals, yvalsbin, 0.5) → bSequence(Poisson[lambda, xvals(i), false], i, 1, n + 1) → yvalspoissonBarChart(xvals, yvalspoisson, 0) → a