
Plotting Quadratic Functions
Loading the math board and drawing, please wait…
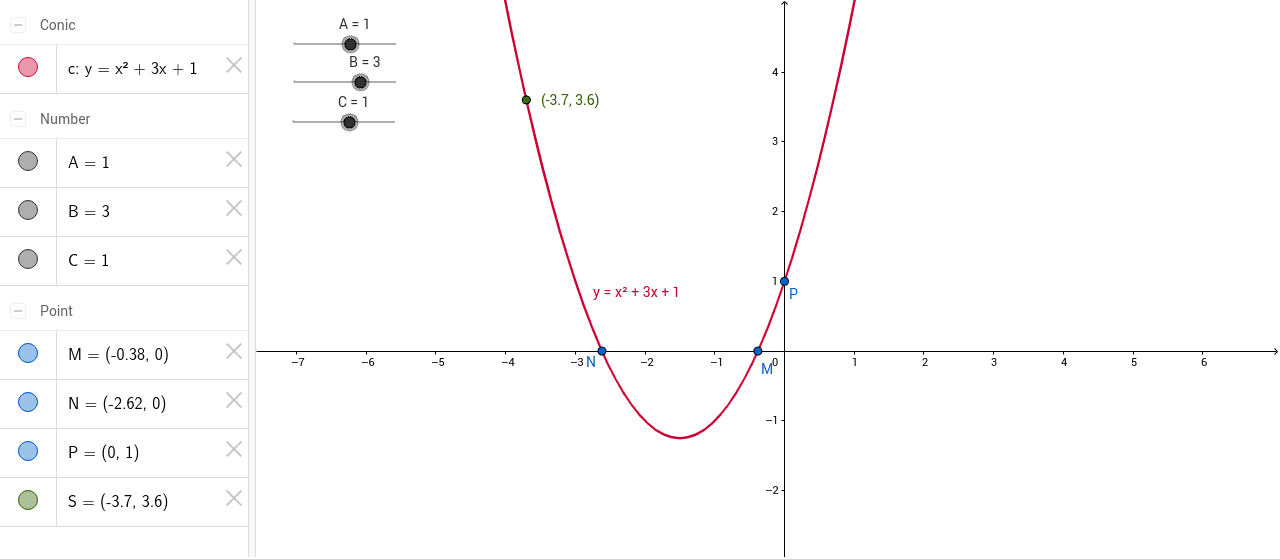
This example demonstrates how to plot quadratic functions. Key mathematical concepts include quadratic functions, vertex, and axis of symmetry. Using commands like Intersect and Point, key points and features of the quadratic function graph are constructed. Suitable for high school mathematics education and learning quadratic function properties.
GeoGebra Commands & Parameters
Intersect(c, xAxis) → M, NIntersect(c, yAxis) → P, QPoint(c) → S
AI Drawing Prompt Reference
Plot a quadratic function, marking the vertex and axis of symmetry, and showing the points where it intersects the x-axis and y-axis. Start by drawing the function curve, then find the intersection points with the axes, and finally label the vertex.
The prompt above was compiled from the original drawing commands and is for reference only.