
Plotting Points on a Graph
Loading the math board and drawing, please wait…
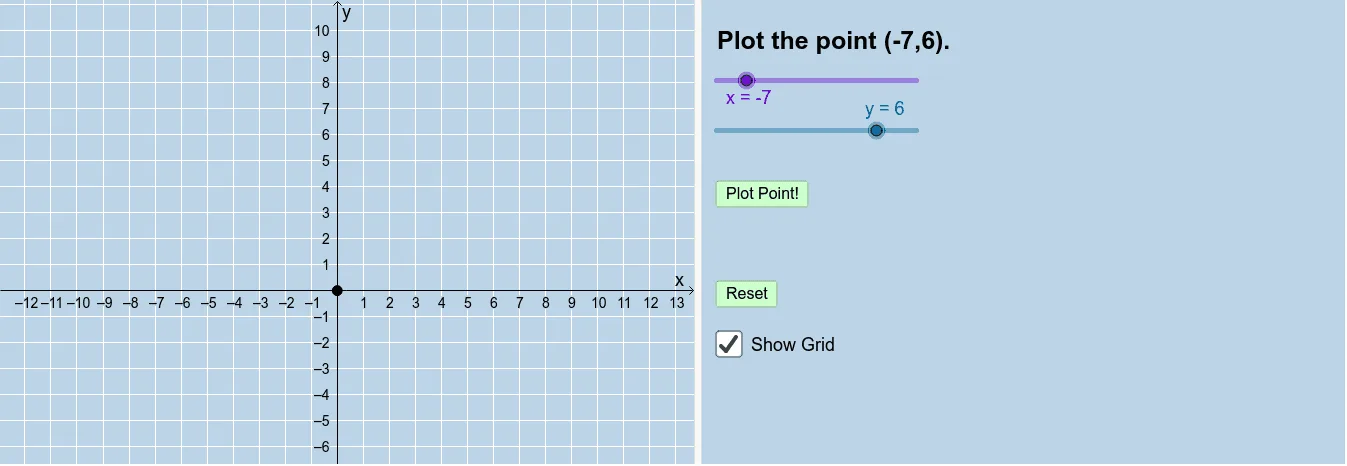
This example demonstrates plotting points on a graph and achieving operations like intersections, dilations, vectors, and distances using GeoGebra commands. Core math concepts include function graphs, Riemann sums, scatter plots, parallelograms, statistical characteristics, and percentages. Key GeoGebra commands and objects used are Intersect, Dilate, Vector, Distance, and j, i, a, b, A, button1, c, d, B, text2, text1, button2, e, f, g, C, h, D, A', E, u, distanceEC, distanceAC, TextAC, C', v, F, G, distanceGD, TextGD, button3, k, button4. Suitable for high school mathematics learning, helping to understand function graph plotting and geometric transformations.
GeoGebra Commands & Parameters
Intersect(f, g) → CIntersect(f, h) → DDilate(A, If[0 < e ≤ 1, 1 - e, 0], C) → A'Vector(E, A') → uDistance(E, C) → distanceECDistance(A, C) → distanceACDilate(C, If[1 < e ≤ 2, 2 - e, 0], D) → C'Vector(C, C') → vIntersect(g, xAxis) → FIntersect(f, g) → GDistance(G, D) → distanceGD
AI Drawing Prompt Reference
Draw two function curves on a coordinate plane and mark their intersections with the horizontal axis. Place a point at one intersection of the curves, and use it as a center to dilate another point by a scale factor controlled by a slider, creating a new point. Draw a vector from a fixed point to this new point, and measure the distance from the fixed point to the intersection. Repeat a similar dilation at another intersection to create another new point and draw a vector. Finally, mark the intersections of the curves with the horizontal axishol and measure the distance between one of these intersections and another intersection point.
The prompt above was compiled from the original drawing commands and is for reference only.