
Plotting Points and Tracing Graphs
Loading the math board and drawing, please wait…
In collections
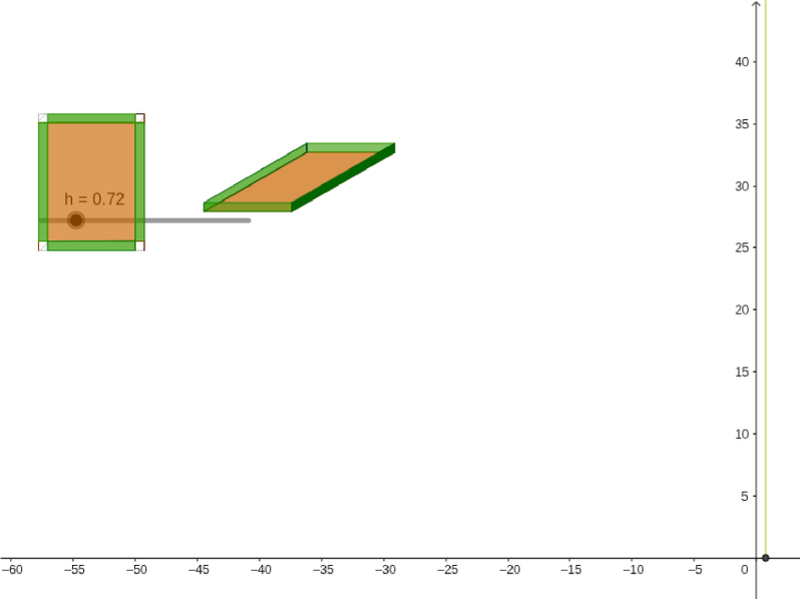
Modeling Volume as a function of height
This example demonstrates how to plot a function by tracing the slopes of its tangents. It involves core mathematical concepts such as derivatives, vectors, geometric transformations, and coordinate geometry. Key GeoGebra commands and objects used in the construction include Circle, Vector, Translate, Intersect, Rotate, Polygon, Segment, OrthogonalLine, Point, Tangent, and Slope. It is suitable for high school and above students studying calculus, function graphing, and geometric constructions.
GeoGebra Commands & Parameters
Circle(Origin, len - (2 * h)) → cVector((width - (2 * h), 0)) → uTranslate(A, u) → A'Intersect(c, xAxis) → B, CRotate(C, α) → C'Vector(C') → vTranslate(A, v) → A'_1Translate(A', v) → A''Polygon(A, A'_1, A'', A') → poly1, a, a'_1, a'', a'Vector((0, h)) → wTranslate(A, w) → A'_2Translate(A', w) → A''_1Translate(A'_1, w) → DTranslate(A'', w) → A'''Segment(A'_2, A) → bSegment(A''_1, A') → dSegment(D, A'_1) → eSegment(A''', A'') → fPolygon(A'_2, A''_1, A', A) → poly2, a'_2, a''_1, a'_3, a_1Polygon(D, A''', A'', A'_1) → poly3, d_1, a''', a''_2, a'_4Polygon(A''_1, A''', A'', A') → poly4, a''_3, a'''_1, a''_4, a'_5Polygon(D, A'_2, A, A'_1) → poly5, d_2, a'_6, a_2, a'_7Segment(W_1, A_2) → c_7Segment(A_2, Z_1) → d_7Segment(Z_1, V_1) → e_7Segment(V_1, W_1) → f_7Segment(Paper, U_1) → g_7Segment(U_1, S_1) → h_7Segment(S_1, T_1) → i_7Segment(T_1, Paper) → j_7OrthogonalLine(Z_1, g_7) → m_7OrthogonalLine(Z_1, h_7) → n_7OrthogonalLine(A_2, h_7) → a_8OrthogonalLine(W_1, i_7) → b_8Intersect(j_7, a_8) → B_2Intersect(i_7, b_8) → C_2Intersect(m_7, i_7) → D_2Intersect(h_7, a_8) → E_2Intersect(n_7, h_7) → F_2Intersect(m_7, g_7) → G_2Intersect(g_7, b_8) → H_2Intersect(n_7, j_7) → I_2Polygon(B_2, W_1, 4) → poly26, c_8, d_8, e_8, f_8, J_2, K_2Polygon(Paper, H_2, 4) → poly27, g_8, h_8, i_8, j_8, L_2, M_2Polygon(G_2, U_1, 4) → poly28, k_8, l_8, m_8, n_8, N_2, O_2Polygon(A_2, E_2, 4) → poly29, p_8, q_8, r_8, s_8, P_2, Q_2Polygon(V_1, Z_1, A_2, W_1) → poly31, v_1, z_1, a_9, w_1Polygon(B_2, W_1, V_1, I_2) → poly9, b_2, w_2, v_2, i_2Polygon(W_1, A_2, D_2, C_2) → poly10, w_3, a_3, d_3, c_2Point(w_3) → NPolygon(N, Z_1, F_2, E_2) → poly11, n_1, z_2, f_2, e_2Point(n_1) → OPoint(w_2) → PPolygon(H_2, G_2, O, P) → poly12, h_3, g_3, o, p_1OrthogonalLine(E, xAxis) → iTangent(E, g) → jSlope(j) → mCircle(E, 3) → kIntersect(k, i) → F, GIntersect(i, xAxis) → HSegment(H, ET) → q
AI Drawing Prompt Reference
Draw a function graph by tracing the slopes of its tangents. Start by creating a circle, then make a vector and translate points, intersect with the x-axis to get two points, rotate one point, create a vector, and translate points to get new points, connecting them to form polygons. Next, create new vectors and points, translate and connect to form more polygons. Finally, create regular polygons and orthogonal lines, connecting intersection points to form complex geometric shapes.
The prompt above was compiled from the original drawing commands and is for reference only.