
Plotting Integer Points in Linear Programming
Loading the math board and drawing, please wait…
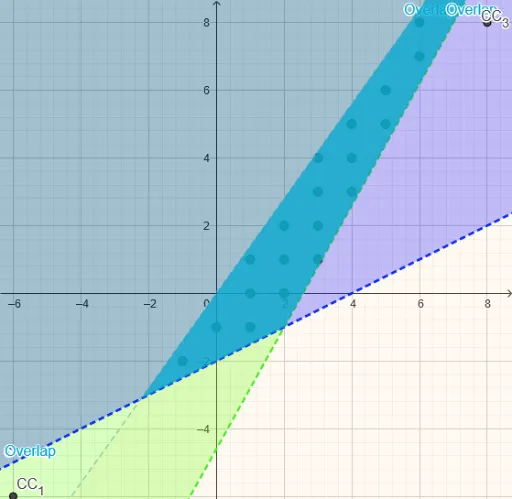
This example demonstrates how to plot integer points in linear programming using GeoGebra. Key mathematical concepts include linear inequalities and integer points. Commands used include Corner, Join, and KeepIf. Suitable for high school mathematics education and students learning linear programming.
GeoGebra Commands & Parameters
Corner(2) → C_{2}Corner(3) → C_{3}Corner(4) → C_{4}Corner(1) → C_{1}Join(Sequence[Sequence[(i, j), j, y(CC_{1}), y(CC_{3})], i, x(CC_{1}), x(CC_{3})]) → IntegerPointsKeepIf(IsInRegion[Q, Overlap], Q, IntegerPoints) → Result
AI Drawing Prompt Reference
Draw a feasible region for a linear programming problem, which is a polygon bounded by several lines. First, identify the four vertices of this polygon. Then, within the rectangular range defined by these vertices, generate all integer-coordinate points (points with both x and y as integers). Next, filter out those integer points that lie inside or on the boundary of the polygon, and display them as prominent dots. The figure should clearly show the polygon's edges and the distribution of integer points, helping to observe integer candidate solutions near the optimum.
The prompt above was compiled from the original drawing commands and is for reference only.