
Plotting Function Graphs with Points
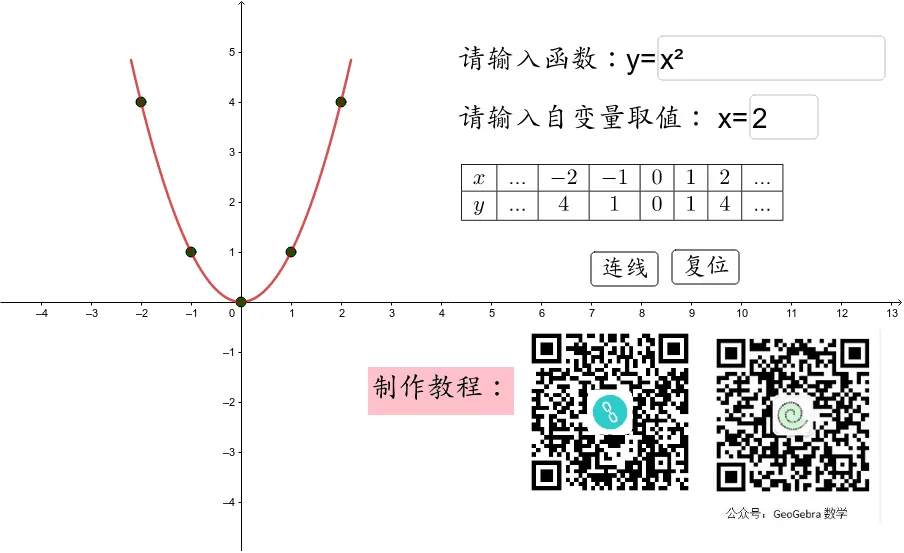
This example demonstrates how to plot function graphs by selecting coordinate points. Key mathematical concepts include function definition, coordinate systems, and point plotting techniques. Construction involves GeoGebra commands such as Textfield, Sort, If, InputBox1, InputBox2, l1, l2, l3, l4, text1, k, g, button1, A, B, pic1, C, D, pic2, text2. Suitable for middle school students learning function graphs or for mathematical teaching assistance.
Loading the math board and drawing, please wait…