
Plotting Coordinates with Fraction Text Display
Loading the math board and drawing, please wait…
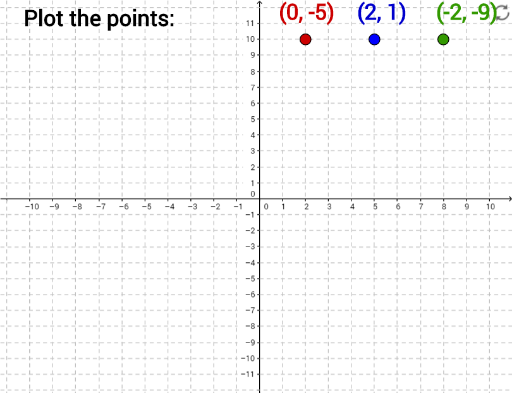
This GeoGebra example demonstrates how to plot multiple coordinate points in a Cartesian plane and use the FractionText command to display coordinates or related values as fractions. The core mathematical concepts include the rectangular coordinate system, point coordinates, fraction-decimal conversion, and basic geometric shapes such as triangles and quadrilaterals. The construction uses the FractionText command to generate fraction text objects, along with multiple points (A, B, C, D, E, F, G, H, etc.), segments, polygons, and a button for interactive control. It is suitable for middle school mathematics lessons on coordinate geometry, fractions, and introductory GeoGebra usage, as well as for teachers creating interactive coordinate plotting demonstrations.
GeoGebra Commands & Parameters
FractionText(((-y(B))) / x(A)) → text12FractionText(((-y(B))) / x(A)) → text13
AI Drawing Prompt Reference
Plot multiple points in a Cartesian plane and display their coordinates as fractions. Draw a geometric shape including triangles and quadrilaterals, and add a slider for interactive control. Use a fraction text command to convert point coordinates to fractions and display them on the graph.
The prompt above was compiled from the original drawing commands and is for reference only.