
Plot the Rotated Figure
Loading the math board and drawing, please wait…
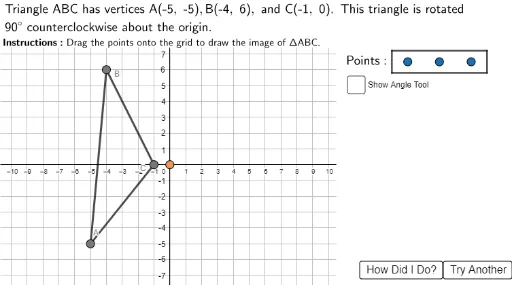
This example demonstrates how to use GeoGebra to plot a rotated figure. The core mathematical concept is rotation transformation. The commands used in the construction summary include Polygon, Join, Point, Segment, Circle, Rotate, Ray, Angle, etc. Suitable for students at junior high school level and above to learn geometric transformations.
GeoGebra Commands & Parameters
Polygon((10.5, 9), (25, 9), (25, -10), (10.5, -10)) → RightBox, j, k, l, mPolygon((-12, 7.4), (25, 7.4), (25, 15), (-12, 15)) → TopBox, f, g, h, iJoin({Sequence[Sequence[(i, j), i, -10, 10, 1], j, -10, 10, 1], {(15, 6.5), (17, 6.5), (19, 6.5)}}) → GridSpacePoint(GridSpace) → A1Point(GridSpace) → B1Polygon((14, 7.2), (14, 5.8), (20, 5.8), (20, 7.2)) → PointsBox, n, p, q, rPoint(GridSpace) → C1Polygon(A, B, C) → ABC, c, a, bPolygon(A1, B1, C1) → ABC1, c1, a1, b1Polygon(Acorr, Bcorr, Ccorr) → ABCcorr, ccorr, acorr, bcorrSegment((0, 7.3), (0, -8)) → yaxisCircle((0, 0), 7) → Circ1Point(Circ1) → RotPtRotate(RotPt, (angledisp * π / 180)) → RotPtbRay(O, RotPt) → sRay(O, RotPtb) → tAngle(RotPt, O, RotPtb) → HelpAngle
AI Drawing Prompt Reference
Draw a grid and select three points A, B, and C on it to form triangle ABC. Then, choose two points A1 and B1 on the y-axis to form another triangle ABC1. Finally, select a point on a circle as the rotation center and rotate it by a certain angle to form a new triangle ABCcorr.
The prompt above was compiled from the original drawing commands and is for reference only.