
Planar Graph Construction
Loading the math board and drawing, please wait…
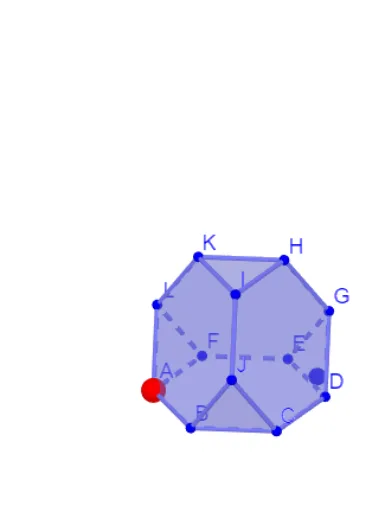
This example demonstrates the construction of a planar graph, illustrating the intersection relationships between polygons and circles. Key mathematical concepts include plane geometry, polygon construction, circle-line intersection, angle measurement, etc. Construction highlights involve using commands like Circle, Intersect, Rotate, Polygon, Line, OrthogonalLine, Angle, Midpoint, Segment, Point, and Textfield. Suitable for high school mathematics education, explaining the basic properties and drawing methods of planar graphs.
GeoGebra Commands & Parameters
Circle(OO, 1, xOyPlane) → cIntersect(yAxis, c, 2) → ARotate(A, 60°) → BRotate(A, 120°) → CRotate(A, 180°) → DRotate(A, 240°) → ERotate(A, 300°) → FPolygon(A, B, C, D, E, F) → veelhoek1, a, b, c_1, d, e, fPolygon(B, A, 6, xOyPlane) → veelhoek2, g, J_1, h, i, j, k, l, G_1, H_1, I_1Polygon(D, C, 6, xOyPlane) → veelhoek3, m, N, n, p, q, r, s, K_1, L_1, MPolygon(F, E, 6, xOyPlane) → veelhoek4, t, R, f_1, g_1, h_1, i_1, j_1, O, P, QCircle(c_1, K_1) → d_1Circle(a, J_1) → e_1Intersect(e_1, d_1) → J, T, ,Line(D, C) → k_1OrthogonalLine(K_1, k_1, xOyPlane) → l_1Intersect(k_1, l_1) → KKAngle(K_1, KK, J) → αRotate(veelhoek3, (-α), c_1) → veelhoek3'Line(OO, OOO) → asRotate(veelhoek3', 120°, as) → veelhoek3''Rotate(veelhoek3', (-(120°)), as) → veelhoek3''_1Rotate(J, (-(120°)), as) → LRotate(J, 120°, as) → GMidpoint(L, J) → UOrthogonalLine(U, veelhoek3''_1) → mmRotate(J, (-(60°)), mm) → IRotate(I, 120°, as) → HRotate(I, (-(120°)), as) → KPolygon(D, E, G) → driehoek1, s'_1, d_2, e_2Rotate(driehoek1, 120°, as) → driehoek1'Rotate(driehoek1, (-(120°)), as) → driehoek1'_1Polygon(W, Z, 6, xOyPlane) → veelhoek5, m_1, D_1, n_1, p_1, q_1, r_1, s_1, A_1, B_1, C_1Segment(C_1, M_1) → t_1Segment(M_1, D_1) → a_1Segment(M_1, N_1) → b_1Segment(N_1, O_1) → f_2Segment(O_1, E_1) → g_2Segment(E_1, W) → h_2Segment(E_1, Z) → i_2Segment(O_1, P_1) → j_2Segment(P_1, F_1) → k_2Segment(F_1, A_1) → l_2Segment(N_1, P_1) → m_2Segment(F_1, B_1) → n_2Point(ribben) → PPPoint(vlakken3) → PPPTextfield(leeg1) → Invulvak1Textfield(leeg2) → Invulvak2
AI Drawing Prompt Reference
Draw a planar graph showing the intersection relationships between polygons and circles. Start by creating a circle and marking its intersections with the coordinate axes. Extend line segments from these points and rotate them to form a hexagon. Then, build multiple connected smaller polygons around the hexagon and add intersection points where the circles meet the polygons. Finally, rotate and connect these points to create a complex geometric structure, labeling key angles and segments.
The prompt above was compiled from the original drawing commands and is for reference only.