
Piecewise Linear Function: Visualizing Domain and Range
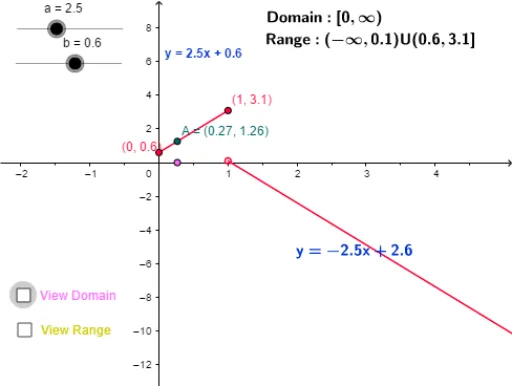
Loading the math board and drawing, please wait…
① This example demonstrates a piecewise function composed of two linear functions, with its domain and range clearly visualized on the graph. ② Core mathematical concepts include piecewise functions, linear functions, domain, range, and function graph continuity. ③ Construction highlights: Based on the construction summary, the GeoGebra commands use Point to create key points, and define multiple objects (f, a, b, text1, B, c, d, e, g, C, text2, A, D, E, F, h, i, text3, text4) which likely serve to mark breakpoints, draw line segments, display text labels, and illustrate domain/range intervals. ④ Suitable for middle and high school mathematics, this interactive graph helps students understand piecewise function behavior, domain/range concepts, and graph analysis. It is ideal for classroom demonstrations or self-paced exploration, allowing users to drag key points and observe how the function changes across intervals.
GeoGebra Commands & Parameters
Point(g) → A
AI Drawing Prompt Reference
Draw a piecewise linear function with two linear parts, showing its domain and range. Start by creating two key points A and B on the line, then draw two line segments representing the two linear parts. Mark points A and B to indicate their range and domain intervals. Finally, add text labels to explain the behavior of the piecewise function and the concepts of domain and range.
The prompt above was compiled from the original drawing commands and is for reference only.