
Piecewise Functions & Statistical Geometry Demo
Loading the math board and drawing, please wait…
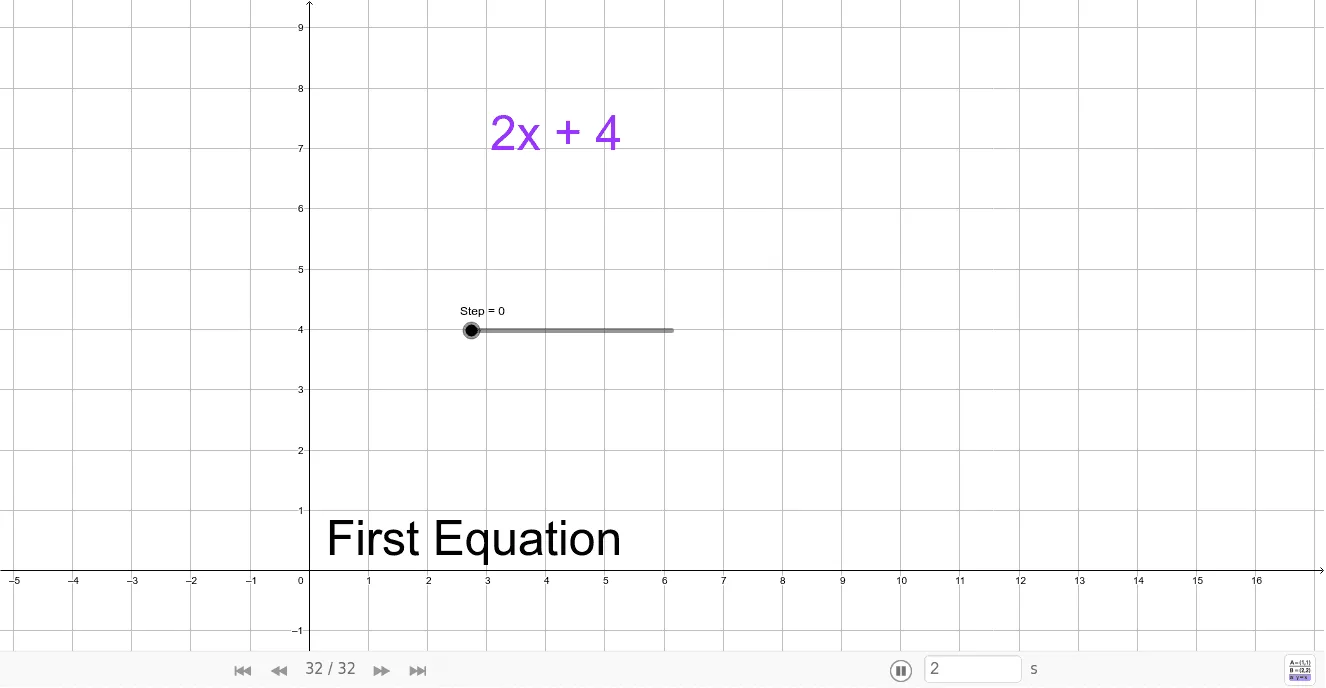
This example demonstrates the graphing of piecewise functions and their integration with statistical geometry concepts like standard deviation, pyramid, geometric mean, surface area, and frequency distribution. Key math concepts include piecewise functions, standard deviation calculation, geometric body surface calculation, and frequency distribution visualization. Construction highlights involve GeoGebra commands/objects such as Point, Line, text elements (text1, A, B, etc.), and dynamic sliders (Step). Suitable for high school and above mathematics education, focusing on function graphing, statistical geometry applications, and dynamic demonstrations.
GeoGebra Commands & Parameters
Point(yAxis) → APoint(yAxis) → BLine(A, C) → aPoint(b) → ELine(A, D) → c