
Pi Visualization
Loading the math board and drawing, please wait…
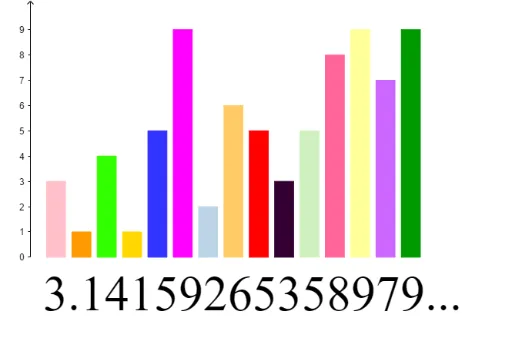
This example demonstrates the calculation and visualization of Pi (π) through dynamic charts. It involves core math concepts like circles, functions, trigonometry, and integration. The construction uses commands such as BarChart and objects A1-B15 for geometric modeling. Suitable for high school mathematics education to understand the numerical calculation and geometric significance of Pi.
GeoGebra Commands & Parameters
BarChart(l1, l2, 0.75) → a