
Phone-friendly Linear Function
Loading the math board and drawing, please wait…
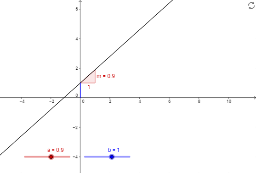
This example demonstrates the graph of a linear function. The key mathematical concepts involved are the slope and y-intercept of a linear function. Using GeoGebra commands Slope, Intersect, and Segment, the graph of a linear function can be constructed. Suitable for students at the junior high school level and above to learn about linear functions.
GeoGebra Commands & Parameters
Slope(c) → mIntersect(xAxis, yAxis) → AIntersect(c, yAxis) → BSegment(A, B) → d
AI Drawing Prompt Reference
Draw the graph of a linear function, showing its slope and y-intercept, by first finding the intersection point of the x-axis and y-axis, then locating another point on the y-axis using the given slope, and finally connecting these two points to form the line.
The prompt above was compiled from the original drawing commands and is for reference only.