
Phasor Diagram and Sine Wave
Loading the math board and drawing, please wait…
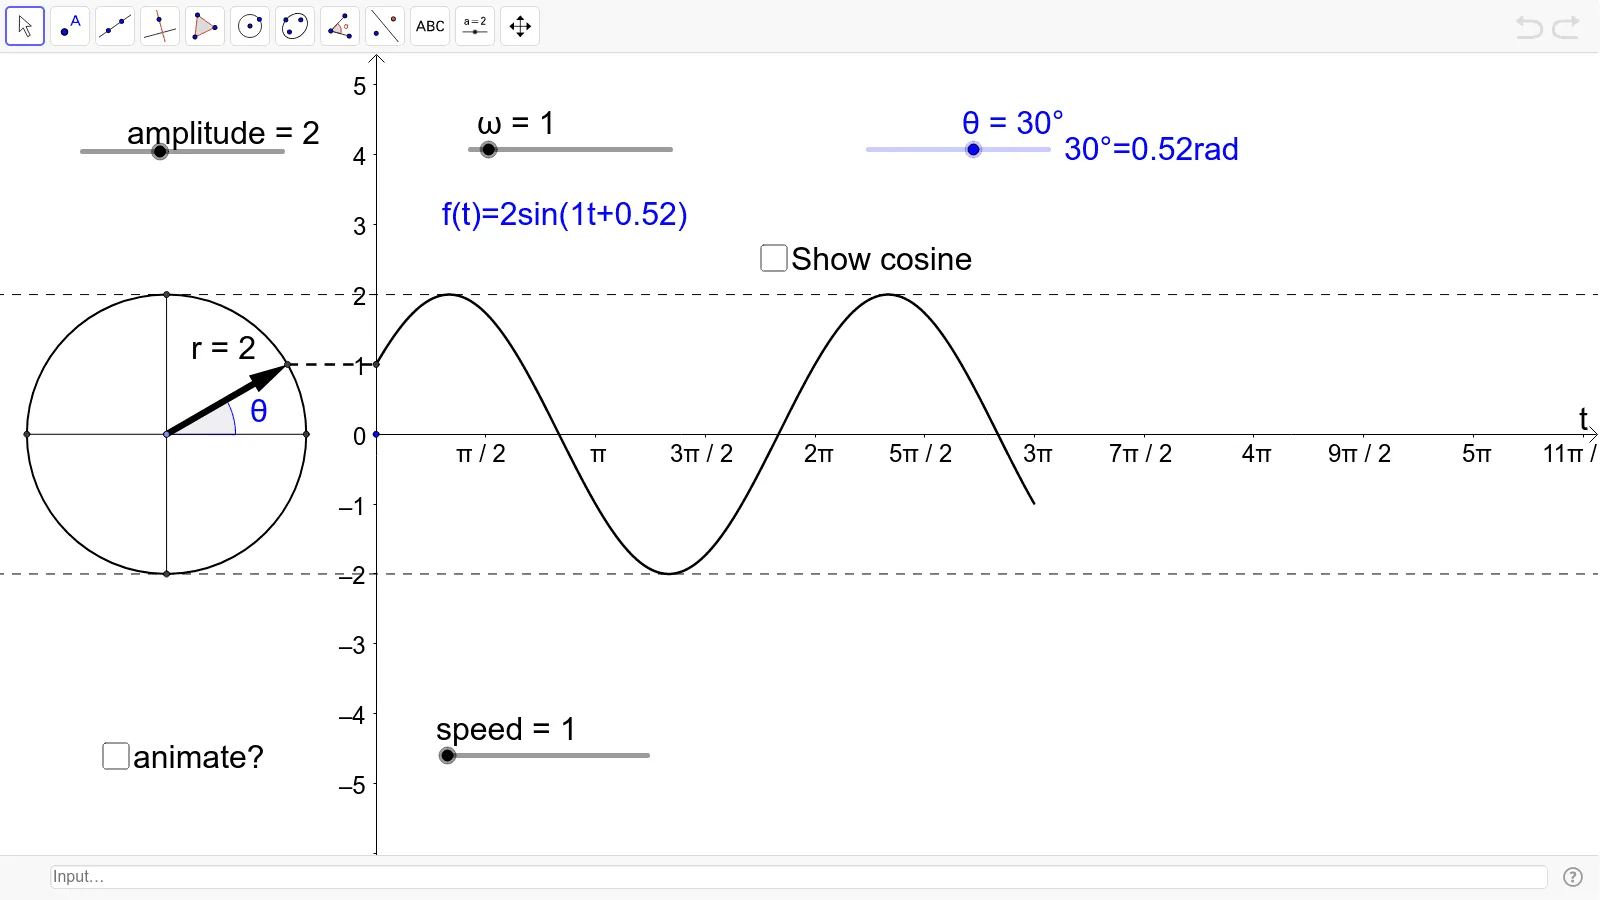
This example demonstrates a sine wave and phasor diagram by adjusting amplitude, angular frequency, and phase angle. It covers the properties of sine functions, involving vector and trigonometry concepts. Commands used include Circle, Rotate, Angle, Vector, and Segment. Suitable for high school and above students to learn about sine functions and vectors.
GeoGebra Commands & Parameters
Circle(C, amplitude) → cRotate(B, θ, C) → B'Angle(B, C, B') → αVector(C, B') → r_1Segment(B', D) → eSegment(G, H) → fSegment(B, E) → hSegment(C, B') → rAngle(B', C, G) → ϕ
AI Drawing Prompt Reference
Draw a demonstration of a sine wave and phasor diagram with adjustable amplitude, angular frequency, and phase angle. Start by drawing a circle to represent the amplitude, then draw a vector from the center to represent the initial phasor. Rotate the vector according to the phase angle and draw a line from its tip to the origin to form the phasor. Finally, plot the corresponding sine wave below the phasor diagram to show its relationship with the phasor.
The prompt above was compiled from the original drawing commands and is for reference only.