
Phantom Graph sine(x) Example
Loading the math board and drawing, please wait…
In collections
Phantom Graphs
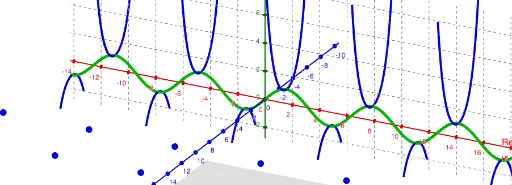
This example demonstrates the dynamic changes of the sine function graph along with its confidence intervals and centroids. It involves core mathematical concepts such as trigonometry, confidence intervals, centroid calculation, combinatorics, rectangles, and linear functions. The construction utilizes GeoGebra commands and objects like Plane and Sequence as outlined in the summary. It is suitable for high school and above learners to understand the integration of function graphs with statistical geometry.
GeoGebra Commands & Parameters
Plane((0, c, 0), (1, c, 0), (-1, c, 3)) → aSequence((π / 2 + (π * n), c, acosh(c)), n, -8, 8, 2) → Pts1Sequence((π / 2 + (π * n), c, (-acosh(c))), n, -8, 8, 2) → Pts2Sequence((π / 2 + (π * n), c, acosh(abs(c))), n, -7, 7, 2) → Pts3Sequence((π / 2 + (π * n), c, (-acosh(abs(c)))), n, -7, 7, 2) → Pts4Sequence(CurveCartesian[π / 2 + (π * n), ((-1)^(n) * cosh(t)), t, t, -20, 20], n, -7, 7) → CurvesSequence((asin(c) + ((2 * k) * π), c), k, -10, 10) → L_1Sequence((π - asin(c) + ((2 * k) * π), c), k, -10, 10) → L_2