
Phantom Graph for A(x-H)^2+K: Visualizing Complex Roots
Loading the math board and drawing, please wait…
In collections
Phantom Graphs
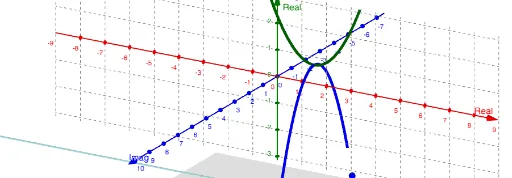
This GeoGebra example illustrates the 'Phantom Graph' of the quadratic function y = A(x-H)^2+K, which extends the real graph into the complex plane to reveal the complex roots when the parabola does not intersect the x-axis. The core mathematical concepts include the vertex form of a quadratic, complex numbers, and the geometric representation of roots in a 3D-like space. The construction employs the GeoGebra commands ComplexRoot to compute the complex roots, CurveCartesian to draw parametric curves, and Plane to create auxiliary planes. Key objects include sliders A, H, K, the function f, complex roots z_1 and z_2, points A1 and A2, segments a and b, and a text label text1. This resource is ideal for high school or undergraduate students learning about complex numbers and their connection to polynomial graphs, as well as for teachers demonstrating the visual meaning of non-real roots.
GeoGebra Commands & Parameters
ComplexRoot(f(x) - c) → z_1, z_2CurveCartesian(H, K - (A * t^(2)), t, t, -25, 25) → aPlane((0, c, 0), (1, c, 0), (0, c, 1)) → b