
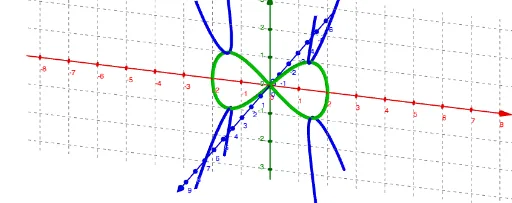
Phantom Graph Figure Eight
Loading the math board and drawing, please wait…
In collections
Phantom Graphs
This example demonstrates the phantom graph of figure eight. It involves core mathematical concepts such as trigonometric functions and continuity. Using GeoGebra commands like Plane, ComplexRoot, CurveCartesian, and Surface, complex figures can be constructed. Suitable for high school mathematics education and learning.
GeoGebra Commands & Parameters
Plane((0, c, 0), (1, c, 1), (-1, c, 2)) → bComplexRoot(x^(4) - (a^(2) * (x^(2) - c^(2)))) → z_1, z_2, z_3, z_4CurveCartesian(sqrt(a^(2) / 2 + t^(2)), ((4 * t^(2)) + a^(2)) / ((2 * a)), t, t, -25, 25) → fCurveCartesian(sqrt(a^(2) / 2 + t^(2)), ((-((4 * t^(2)) + a^(2)))) / ((2 * a)), t, t, -25, 25) → iCurveCartesian((-sqrt(a^(2) / 2 + t^(2))), ((4 * t^(2)) + a^(2)) / ((2 * a)), t, t, -25, 25) → jCurveCartesian((-sqrt(a^(2) / 2 + t^(2))), ((-((4 * t^(2)) + a^(2)))) / ((2 * a)), t, t, -25, 25) → SSurface((a * cosh(t) / sqrt(2)), w, (a * sinh(t) / sqrt(2)), t, -25, 25, w, -25, 25) → eSurface(((-a) * cosh(t) / sqrt(2)), w, (a * sinh(t) / sqrt(2)), t, -25, 25, w, -25, 25) → g
AI Drawing Prompt Reference
Draw a figure eight phantom graph using parametric equations and hyperbolic functions. First, draw a plane, then use complex roots and Cartesian curve equations to construct four curves forming the eight-leaf shape. Finally, use hyperbolic cosine and sine functions to draw two surfaces, together forming the figure eight phantom graph.
The prompt above was compiled from the original drawing commands and is for reference only.