
Percents, Fractions and Decimals
Loading the math board and drawing, please wait…
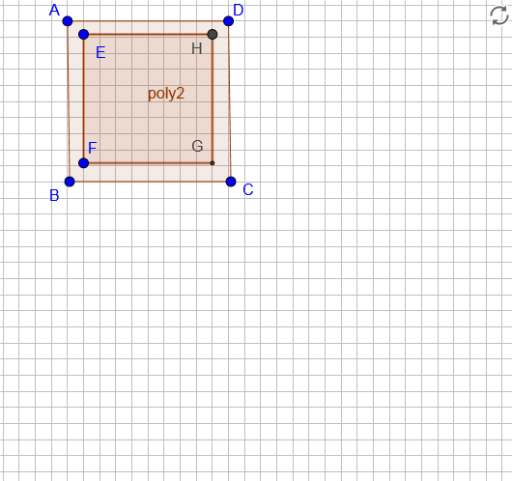
This example demonstrates the visual representation of converting between percents, fractions, and decimals using geometric diagrams. Core math concepts include percents, fractions, decimals, geometric construction, and representation. It utilizes GeoGebra commands like Polygon and objects such as A, B, C, D, poly1, a, b, c, d, E, F, poly2, f, g, h, i, G, H. Suitable for middle school and above, helping students understand numerical form conversions and their geometric significance.
GeoGebra Commands & Parameters
Polygon(A, B, C, D) → poly1, a, b, c, dPolygon(E, F, 4) → poly2, f, g, h, i, G, H
AI Drawing Prompt Reference
Draw a quadrilateral with four vertices and a square with four equal sides, placed side by side. Fill both shapes with semi-transparent colors to highlight their areas. Inside the quadrilateral, divide it into several smaller regions using line segments, each representing a different numerical proportion. Inside the square, divide it into equal parts with lines, and label each part with its corresponding percentage, fraction, and decimal form. The overall layout should clearly illustrate the conversion relationships among these numerical representations.
The prompt above was compiled from the original drawing commands and is for reference only.