
Percentage Calculation Graphical Demo
Loading the math board and drawing, please wait…
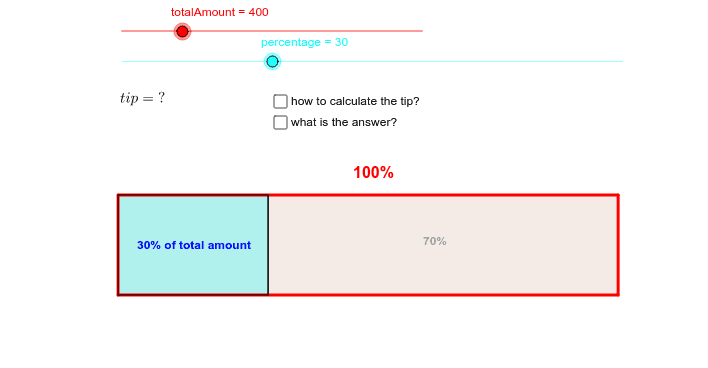
This example demonstrates the graphical representation of percentage calculations for a total amount. It involves core math concepts like percentages, functions, and geometric constructions. Constructed using GeoGebra commands such as Point, Segment, OrthogonalLine, Circle, Intersect, Polygon, and Midpoint. Suitable for middle school and above mathematics education to understand percentage calculations and geometric representations.
GeoGebra Commands & Parameters
Point(Circle[A, 10]) → BSegment(A, B) → aOrthogonalLine(B, a) → bCircle(A, 2) → cOrthogonalLine(A, a) → dIntersect(c, d) → D_2, DOrthogonalLine(D, d) → eIntersect(b, e) → EPolygon(A, B, E, D) → poly1, a_1, b_1, e_1, d_1Segment((0.1 * percentage, x(A)), Point[Circle[(0.1 * percentage, y(A)), 2]]) → f_1Segment((0.1 * percentage + x(A), y(A)), (0.1 * percentage + x(A), y(D))) → fIntersect(f, e_1) → FIntersect(f, a_1) → GMidpoint(A, F) → CMidpoint(G, E) → HMidpoint(D, E) → IPolygon(A, G, F, D) → poly2, a_2, g, f_2, d_2
AI Drawing Prompt Reference
Draw a graph to demonstrate percentage calculations, involving a circle and a point, constructing multiple line segments and geometric shapes to show the relationship between percentages and geometry. Start by drawing a circle and a point, then connect them with a line segment, construct perpendicular lines, find intersection points, and finally form polygons using these points to illustrate the percentage calculation process.
The prompt above was compiled from the original drawing commands and is for reference only.