
Pendulum Wave and Aliasing: Different Sinusoids Fitting the Same Samples
Loading the math board and drawing, please wait…
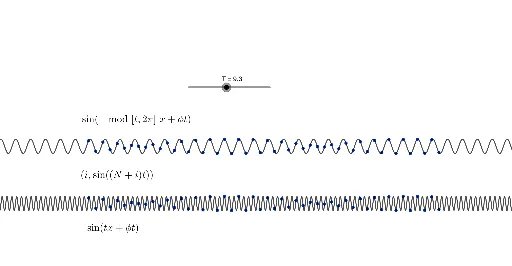
This GeoGebra example demonstrates the phenomenon of aliasing in digital signal processing through an animated pendulum wave. It shows how two different sinusoidal functions with distinct frequencies can pass through the exact same set of discrete sample points, making them indistinguishable when sampled. The core mathematical concepts involve sine functions, frequency, sampling theorem, and aliasing. The construction uses the Sequence command to generate a series of pendulum elements (objects T, N, ϕ), along with text objects (text1, text2, text3) to label parameters, and lists L1, l2 with functions g and f to plot the two sinusoids that fit the same samples. This is suitable for high school and above to explore trigonometry, wave motion, or introductory signal processing, and serves as an excellent visual aid for university physics or digital signal processing courses.
GeoGebra Commands & Parameters
Sequence(PointList[{{i, sin(((N + i) * T)) + 8}}], i, 1, 50) → L1Sequence(PointList[{{i, sin(((N + i) * T))}}], i, 1, 50) → l2