
Pattern of Maximum Sum of Mutual Distances on a Sphere with Increasing Number of
Loading the math board and drawing, please wait…
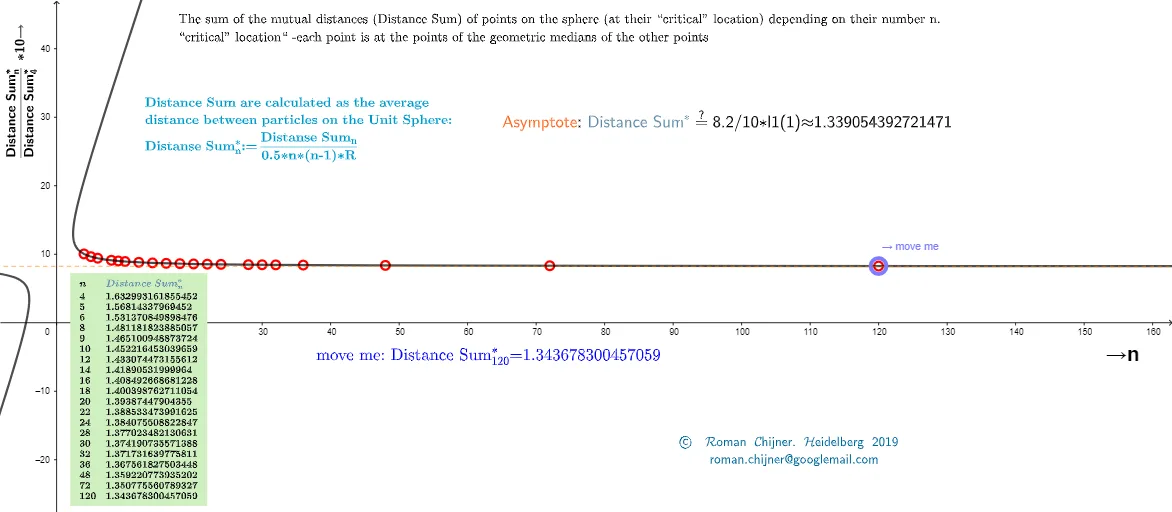
This example demonstrates the pattern of the maximum sum of mutual distances on a sphere as the number of points increases. Key mathematical concepts include geometric construction and optimization. It utilizes commands such as Sequence, TableText, Zip, and Point in GeoGebra. Suitable for high school students and math enthusiasts.
GeoGebra Commands & Parameters
Sequence((2 * Element[pumfang0, i] / (((i + 3) * (i + 2)))), i, 1, Length[pumfang0]) → pumfang1TableText({Join[{{"n"}, Sequence[i, i, 4, Length[pumfang0] + 3]}], Join[{{"P_n"}, pumfang0}], Join[{{" p_n=P_n/[n*(n-1)/2]"}, pumfang1}], Join[{{"p_n/p_4"}, pumfang2}]}, "vl") → text8Zip((a, (10 * b)), a, l0, b, l1') → l_fSequence(Text[l0(i)], i, 1, Length[l0]) → l2TableText(Join[{{"n"}, Sequence[Text[l0(i)], i, 1, Length[l0]]}], Join[{{"\fgcolor{#5D8AA8}{Distance\; Sum^*_n}"}, l1}], "vl") → text8aPoint(l_f) → AIndexOf(A, l_f) → cRotateText(text4, 90°) → Text1
AI Drawing Prompt Reference
Draw a pattern on a sphere showing the maximum sum of mutual distances as the number of points increases. Display the sequence of points and their corresponding distance sums, highlight each point's position, and use different colors to indicate varying distance sums, with text annotations explaining each part.
The prompt above was compiled from the original drawing commands and is for reference only.