
Partial Pictures Task
Loading the math board and drawing, please wait…
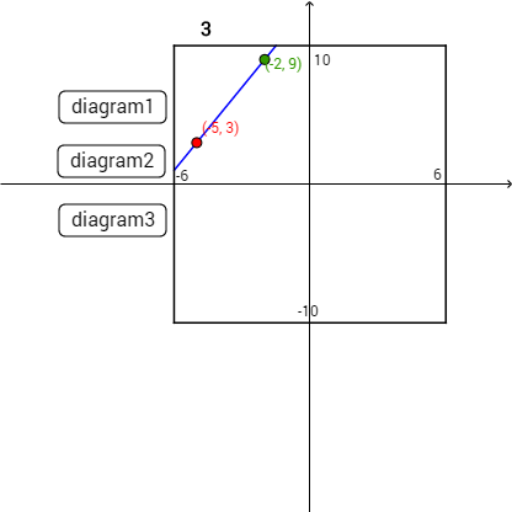
This example demonstrates how to create and analyze partial images using GeoGebra, including polygons, lines, and text annotations. It involves core mathematical concepts such as arithmetic, natural numbers, logarithms, standard deviation, and histograms. The construction uses commands like Polygon, Line, and Textfield, with objects like poly1, f, g, h, i, A, B, and interactive elements like InputBox. Suitable for high school mathematics education, focusing on data analysis and statistical graphing.
GeoGebra Commands & Parameters
Polygon((-6, 10), (6, 10), (6, -10), (-6, -10)) → poly1, f, g, h, iLine(B, A) → jLine(D, C) → kLine(F, E) → lTextfield(f_1) → InputBox1Textfield(f_2) → InputBox2Textfield(f_3) → InputBox3
AI Drawing Prompt Reference
Draw a square centered at the origin with side length 20, its four sides represented by four straight lines. Inside the square, draw three diagonal lines, each connecting points on opposite sides of the square, creating an intersecting geometric structure. Below or beside the square, place three input boxes for entering numerical values or function expressions, allowing interactive adjustment of certain parameters in the figure. The overall composition is clean, emphasizing the connection between geometric shapes and data input, suitable for mathematics education on functions and probability.
The prompt above was compiled from the original drawing commands and is for reference only.