
Partial Derivatives: Visualizing Tangent Lines on a Surface
Loading the math board and drawing, please wait…
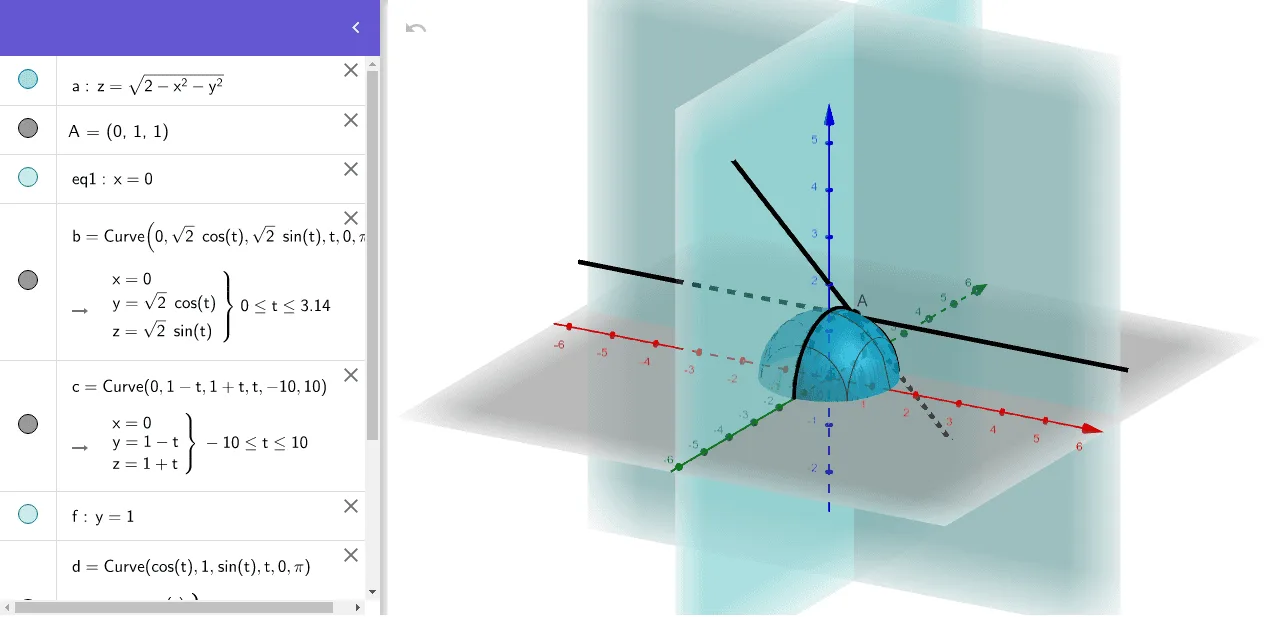
This GeoGebra example demonstrates the geometric meaning of partial derivatives for a multivariable function by showing a surface in 3D with tangent lines along coordinate directions. The core mathematical concept is the partial derivative, which measures the rate of change of the function with respect to one variable while holding the other fixed, visualized as the slope of the tangent line to the curve formed by intersecting the surface with a vertical plane. The construction uses the CurveCartesian command to create parametric curves, along with sliders (a, b, c) to dynamically adjust the surface shape and the point of tangency. Objects such as A, eq1, f, d, and e define the surface equation, auxiliary lines, or tangent planes. This is suitable for university-level calculus or advanced high school mathematics, helping students grasp the difference between partial derivatives and directional derivatives, and understand the local linear approximation via tangent planes. By dragging sliders, learners can observe how partial derivative values change at different points, enhancing spatial reasoning and intuitive comprehension.
GeoGebra Commands & Parameters
CurveCartesian(0, (sqrt(2) * cos(t)), (sqrt(2) * sin(t)), t, 0, π) → bCurveCartesian(0, 1 - t, 1 + t, t, -10, 10) → cCurveCartesian(cos(t), 1, sin(t), t, 0, π) → dCurveCartesian((-t), 1, 1, t, -10, 10) → e