
Parametric Curves and Geometric Mean Demo
Loading the math board and drawing, please wait…
In collections
LINEAR FUNCTIONS
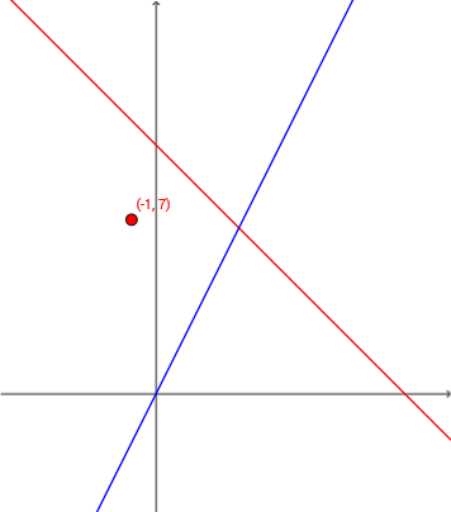
This example dynamically demonstrates parametric curves while visualizing the calculation and geometric mean. It involves core concepts like parametric equations, geometric mean, and special points. Constructed using commands like Random, RandomElement, Textfield, TableText for data generation and dynamic display, it's suitable for high school mathematics teaching on practical applications of parametric curves and geometric mean.
GeoGebra Commands & Parameters
Random(-10, 10) → aRandom(-10, 10) → bRandomElement({-5, -4, -3, -2, -1, 1, 2, 3, 4, 5}) → cTextfield(h) → InputBox1RandomElement({-5, -4, -3, -2, -1, 1, 2, 3, 4, 5}) → a_1Random(-10, 10) → b_1RandomElement({-5, -4, -3, -2, -1, 1, 2, 3, 4, 5}) → c_1Random(-10, 10) → d_1Textfield(m) → InputBox2TableText({{A1_1, B1_1, C_1, D_1}, {-3, g(-3), h(-3), f(-3)}, {-2, g(-2), h(-2), f(-2)}, {-1, g(-1), h(-1), f(-1)}, {0, g(0), h(0), f(0)}, {1, g(1), h(1), f(1)}, {2, g(2), h(2), f(2)}, {3, g(3), h(3), f(3)}, {p, e, l, k}}, "|_r") → text3_1
AI Drawing Prompt Reference
Create a dynamic educational diagram illustrating parametric curves and geometric mean. Include two randomly generated parametric curves with adjustable coefficients, plus two input boxes for parameter values. Display a data table showing function outputs for various inputs, highlighting special points related to the geometric mean. The layout should be clear for classroom use, emphasizing how parameter changes affect curve shapes and the geometric mean calculation.
The prompt above was compiled from the original drawing commands and is for reference only.