
Parametric Curve Demo
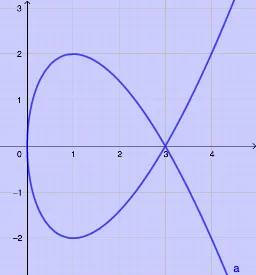
Loading the math board and drawing, please wait…
In collections
Exploring Parametric Curves
This example demonstrates how to plot a 2D curve using parametric equations and show its tangent lines. Key math concepts include parametric equations, derivatives, tangents, and coordinate geometry. It uses GeoGebra commands like CurveCartesian for plotting curves and Tangent for tangents, with objects a, t, A, f, b, c for parametric control. Suitable for high school and above students learning parametric equations and derivatives, or for mathematical education demonstrations.
GeoGebra Commands & Parameters
CurveCartesian(t^(2), t^(3) - (3 * t), t, -5, 5) → aTangent(A, a) → f
AI Drawing Prompt Reference
Plot a 2D parametric curve with parameter t ranging from -5 to 5, where the x-coordinate is t squared and the y-coordinate is t cubed minus three times t. Place a movable point on the curve and draw the tangent line at that point, which updates dynamically as the point moves. The graph should clearly show the curve's shape, the tangent line's position, and its point of contact, illustrating the geometric meaning of derivatives for parametric equations. Keep the visualization clean, emphasizing the interaction between the curve and the tangent for educational demonstration.
The prompt above was compiled from the original drawing commands and is for reference only.