
Parabolas in tx-axis
Loading the math board and drawing, please wait…
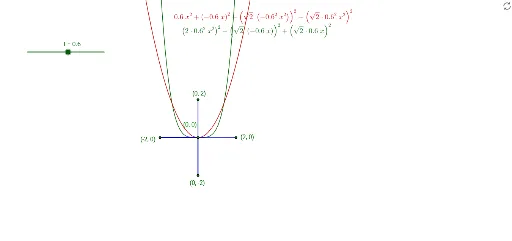
This example demonstrates the graph of parabolas in the tx-axis. It involves the basic properties of parabolas and the application of inequalities. By constructing parabolas f and g, and their intersections with the t-axis at points A, B, C, and D, one can observe the changes in the parabolas in different intervals. The Segment command was used to connect these points. Suitable for high school mathematics education and learning.
GeoGebra Commands & Parameters
Segment(A, D) → hSegment(A, C) → iSegment(A, E) → jSegment(A, B) → k
AI Drawing Prompt Reference
Draw a coordinate plane with the horizontal axis representing time and the vertical axis representing a function value. Plot two parabolas that intersect the horizontal axis at four distinct points, labeled from left to right as the first, second, third, and fourth intersection points. From the leftmost intersection point, draw three straight line segments to each of the other three intersection points, creating a fan-like arrangement. These segments, together with the parabolas, illustrate how the function behaves across different intervals, particularly highlighting regions where inequalities hold. The overall composition is clean, focusing on the intersections and connecting lines.
The prompt above was compiled from the original drawing commands and is for reference only.