
Parabola Table of Value Example
Loading the math board and drawing, please wait…
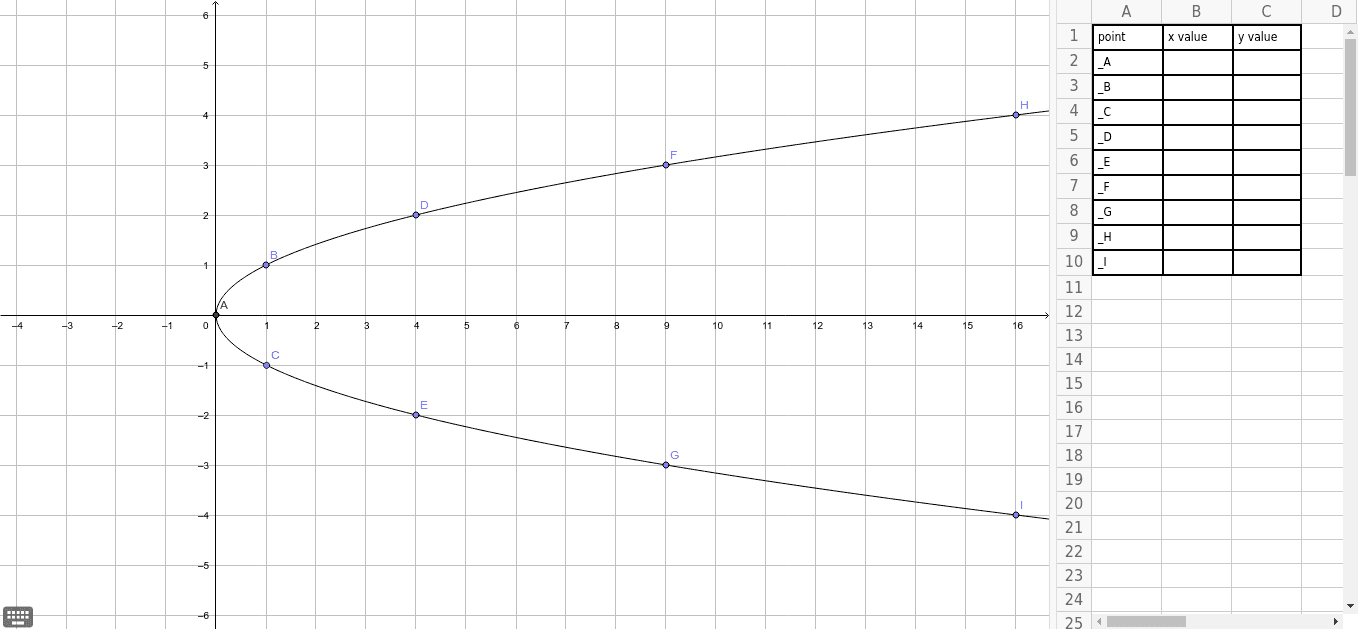
This example demonstrates how to plot a parabola using tabular data. Key mathematical concepts include quadratic functions, coordinate systems, and geometric transformations. Construction involves GeoGebra commands like Intersect and Point, with objects such as c, A, B, C, D, E, F, G, H, I, A1 to A10. Suitable for middle school students learning parabola plotting and geometric transformations.
GeoGebra Commands & Parameters
Intersect(c, xAxis, 1) → APoint(c) → BPoint(c) → CPoint(c) → DPoint(c) → EPoint(c) → FPoint(c) → GPoint(c) → HPoint(c) → I
AI Drawing Prompt Reference
Draw a parabola using tabular data. Include points A, B, C, D, E, F, G, H, I in the coordinate system. Point A is the intersection of the x-axis and the parabola. Other points are generated from coordinates. Ensure the graph is clear and shows the shape and position of the parabola.
The prompt above was compiled from the original drawing commands and is for reference only.