
Outlier Influence on Mean and Median
Loading the math board and drawing, please wait…
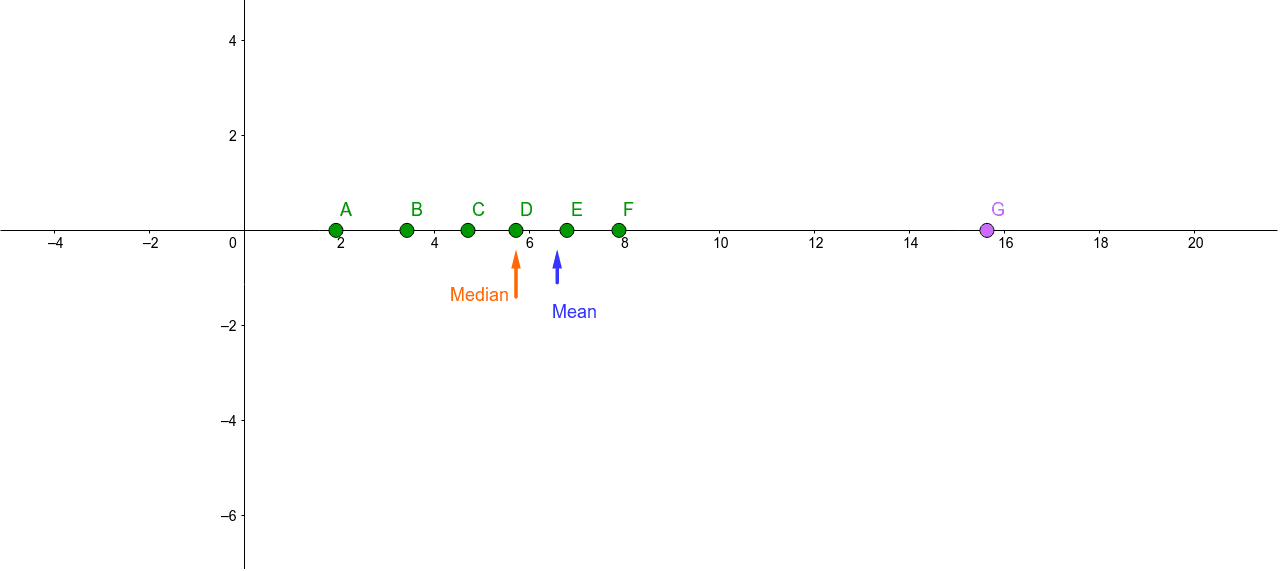
This example demonstrates how outliers affect the mean and median of a dataset. Key math concepts include mean, median, and data distribution. It is constructed using GeoGebra commands like Point, Median, Mean, and Vector. Suitable for middle school and above, helping learners understand the impact of extreme values on statistics.
GeoGebra Commands & Parameters
Point(xAxis) → APoint(xAxis) → BPoint(xAxis) → CPoint(xAxis) → DPoint(xAxis) → EPoint(xAxis) → FPoint(xAxis) → GMedian({x(A), x(B), x(C), x(D), x(E), x(F), x(G)}) → medMean({x(A), x(B), x(C), x(D), x(E), x(F), x(G)}) → μVector((med, (-1.4)), (med, (-0.4))) → v_mVector((μ, (-1.1)), (μ, (-0.4))) → v_a
AI Drawing Prompt Reference
Draw seven points on the horizontal axis, then calculate the median and mean of these points. Draw two vectors above the median and mean, extending from the median to (median, -0.4) and from the mean to (mean, -0.4), to show the influence of outliers on the median and mean.
The prompt above was compiled from the original drawing commands and is for reference only.