
One-Sample T-Test
Loading the math board and drawing, please wait…
In collections
学习 GeoGebra 经典应用
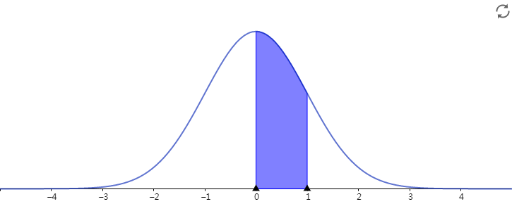
This example demonstrates how to conduct a one-sample T-Test. A one-sample T-Test is a statistical method used to compare the mean of a sample with a known population mean or the means of two samples. Key mathematical concepts include probability statistics, hypothesis testing, and the T-distribution. Construction points include using GeoGebra's statistical analysis tools and chart features. Suitable for introductory statistics courses and research design.
AI Drawing Prompt Reference
Create a statistical diagram illustrating a one-sample t-test. Draw a bell-shaped t-distribution curve centered on the horizontal axis. Shade the rejection regions in both tails of the curve. Mark the sample mean with a vertical line or point on the axis, and add a reference line for the known population mean. Include axis labels, tick marks, and annotations for the t-statistic and p-value areas. The overall style should be clean and educational, emphasizing the comparison between the sample mean and the population mean in hypothesis testing.
The prompt above was compiled from the original drawing commands and is for reference only.