
Odd Power Functions: Graphing and Properties Exploration
Loading the math board and drawing, please wait…
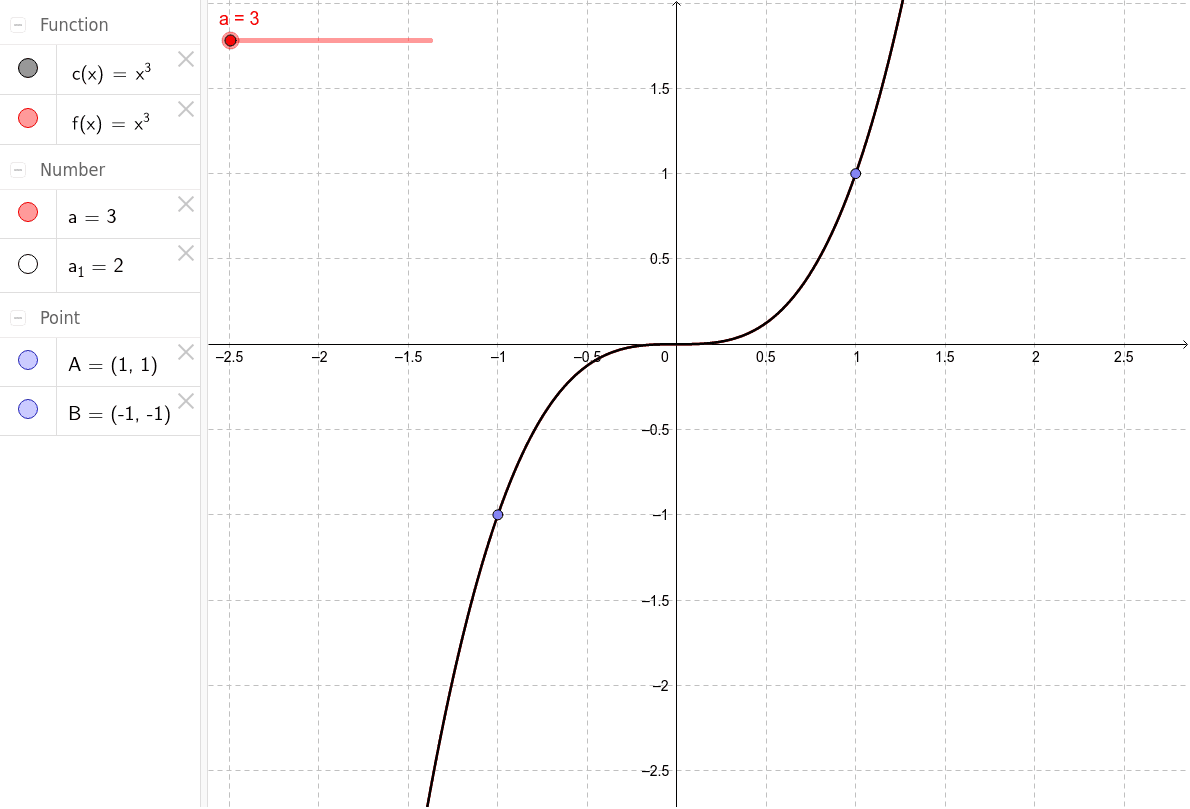
This GeoGebra example demonstrates graphing and analyzing odd power functions y=xⁿ (where n is an odd integer). Using the Point command, points are constructed on the function curve (objects: a_1, a, f, A, c, B) to observe the origin symmetry property of odd power functions. Core mathematical concepts covered: definition of power functions, symmetry of odd functions (f(-x)=-f(x)), zeros and extrema of functions. Construction highlights: dynamic points on the curve via Point command, parameter-controlled visualization of function evolution, optional tangent lines to explore derivative properties. Suitable for high school mathematics instruction on function concepts, power function property exploration, and competition training.
GeoGebra Commands & Parameters
Point(f) → APoint(c) → B