
Observing More Patterns in Scatter Plots
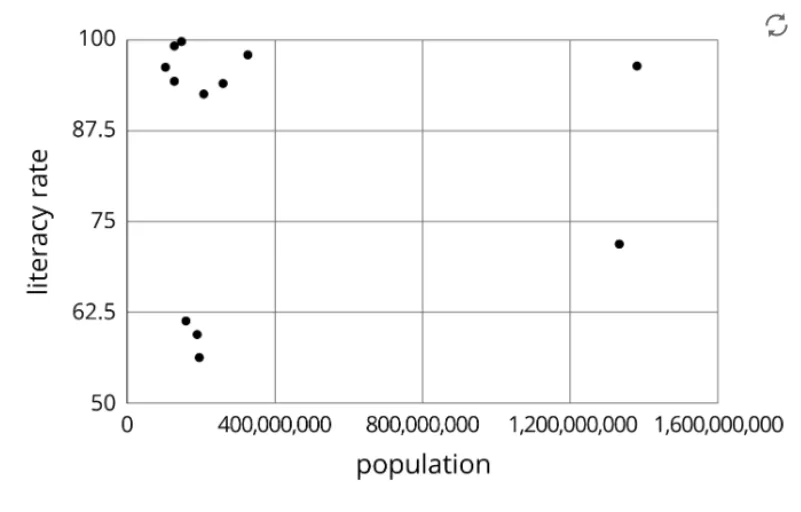
Loading the math board and drawing, please wait…
This example demonstrates data distribution patterns through scatter plots, involving core concepts like vectors, straight lines, median value, and geometric mean. It uses GeoGebra commands/objects A, B, C, D, E, F, pic1 for construction, suitable for middle school and above mathematics education focusing on data analysis and visualization.
GeoGebra Commands & Parameters
Point A(-12, 1)Point B(-12, 5)Point C(-6, 5)Point D(-6, 1)Point E(-13, -3)Point F(4, -3)
AI Drawing Prompt Reference
Create a scatter plot illustrating data distribution patterns. Place six points on a coordinate plane: four points forming a rectangle on the left side, with two points aligned horizontally at the top and two at the bottom, serving as the rectangle's vertices. Add two additional points below the rectangle, one to the left and one to the right, roughly on a horizontal line. Connect the four rectangle vertices with straight lines to emphasize the shape, and label all points clearly. The plot should highlight patterns in data distribution, suitable for middle school math education.
The prompt above was compiled from the original drawing commands and is for reference only.