
Number Line Data Set & Statistics
Loading the math board and drawing, please wait…
In collections
Probability & Intro. to Stat.
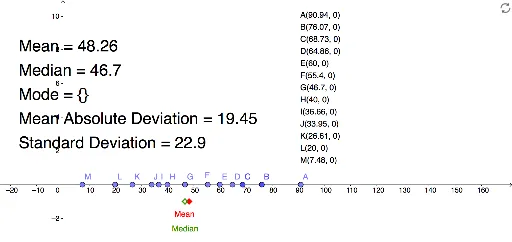
This example demonstrates a number line data set and its statistical information. By calculating statistics such as mean, median, mode, and standard deviation, it helps understand data distribution characteristics. GeoGebra commands like Point, MeanX, SDX are used to construct data points and statistics on the number line. Suitable for high school mathematics, particularly statistics and probability courses.
GeoGebra Commands & Parameters
Point(xAxis) → APoint(xAxis) → DPoint(xAxis) → EPoint(xAxis) → FPoint(xAxis) → GPoint(xAxis) → HPoint(xAxis) → IPoint(xAxis) → JPoint(xAxis) → KPoint(xAxis) → LPoint(xAxis) → MPoint(xAxis) → CPoint(xAxis) → BMeanX(L_1) → MEANSDX(L_1) → StdDevMedian(L_2) → MEDIANMode(L_2) → MODEMean(abs(L_2 - MEAN)) → MAD
AI Drawing Prompt Reference
Draw a horizontal number line in a coordinate system and mark multiple points on it. Then calculate and display the mean, median, mode, and standard deviation of these points, showing the statistical characteristics of the data distribution.
The prompt above was compiled from the original drawing commands and is for reference only.