
Normal Distribution Probability Calculation
Loading the math board and drawing, please wait…
In collections
学习 GeoGebra 经典应用
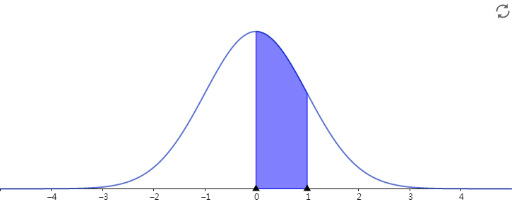
This example demonstrates how to calculate the probability of a normal distribution using GeoGebra. The normal distribution is a fundamental concept in probability theory and statistics, describing the distribution of random variables. Through this example, users can learn about the basic concepts of the normal distribution, including its probability density function and cumulative distribution function. The example uses GeoGebra's graphing capabilities, allowing users to drag sliders to change the parameters of the normal distribution and observe its effect on probability. This example is suitable for middle school, high school, and university mathematics classrooms, particularly for teaching probability theory and statistics.
AI Drawing Prompt Reference
Draw a normal distribution probability density function and cumulative distribution function. First, plot the normal distribution curve. Then, add two sliders to represent the mean and standard deviation. Observe the curve changes by moving the sliders. Next, plot the cumulative distribution function curve, which represents the probability of values less than a given value.
The prompt above was compiled from the original drawing commands and is for reference only.