
Normal Distribution of Theft Losses
Loading the math board and drawing, please wait…
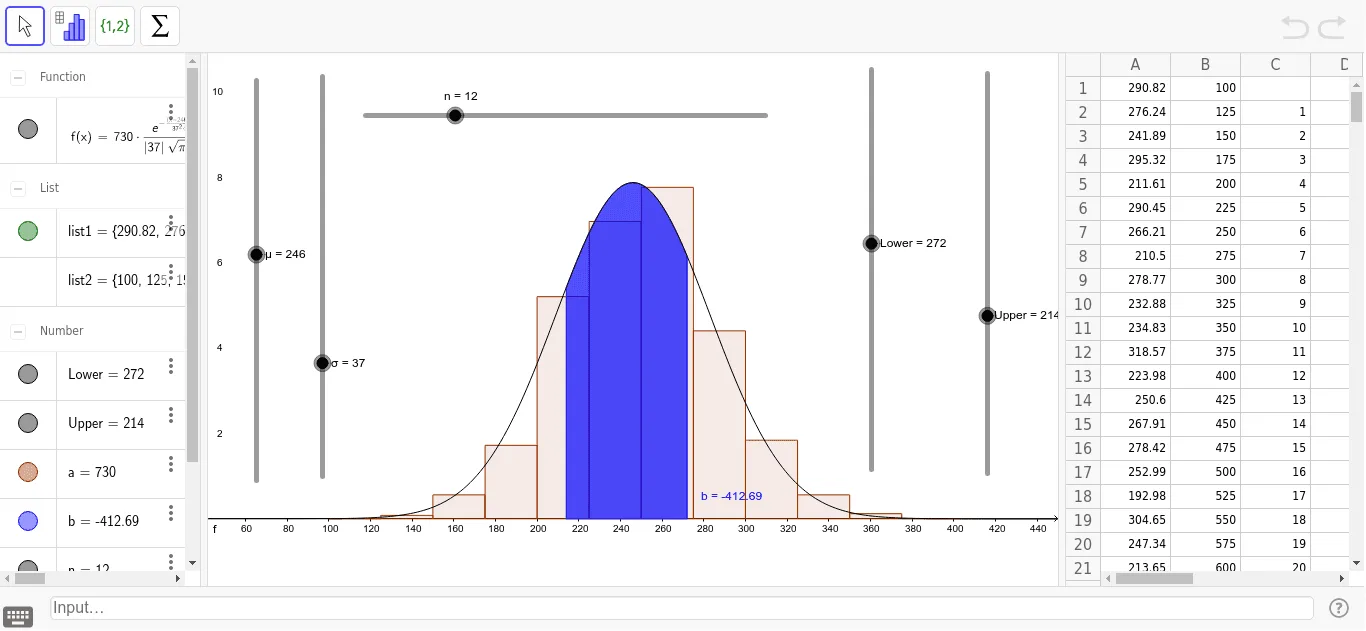
This example demonstrates the normal distribution of theft losses, showcasing data concentration through a bell curve. Key math concepts include normal distribution, integral calculus, inequalities, and numerical analysis. Constructed using GeoGebra's histogram and integral commands with objects A2-A41. Suitable for high school and above, ideal for understanding statistical distributions and calculus applications.
GeoGebra Commands & Parameters
Histogram(list2, list1, true, 1) → aIntegral(f, Lower, Upper) → b