
Normal Distribution Demo by robertsimon151
Loading the math board and drawing, please wait…
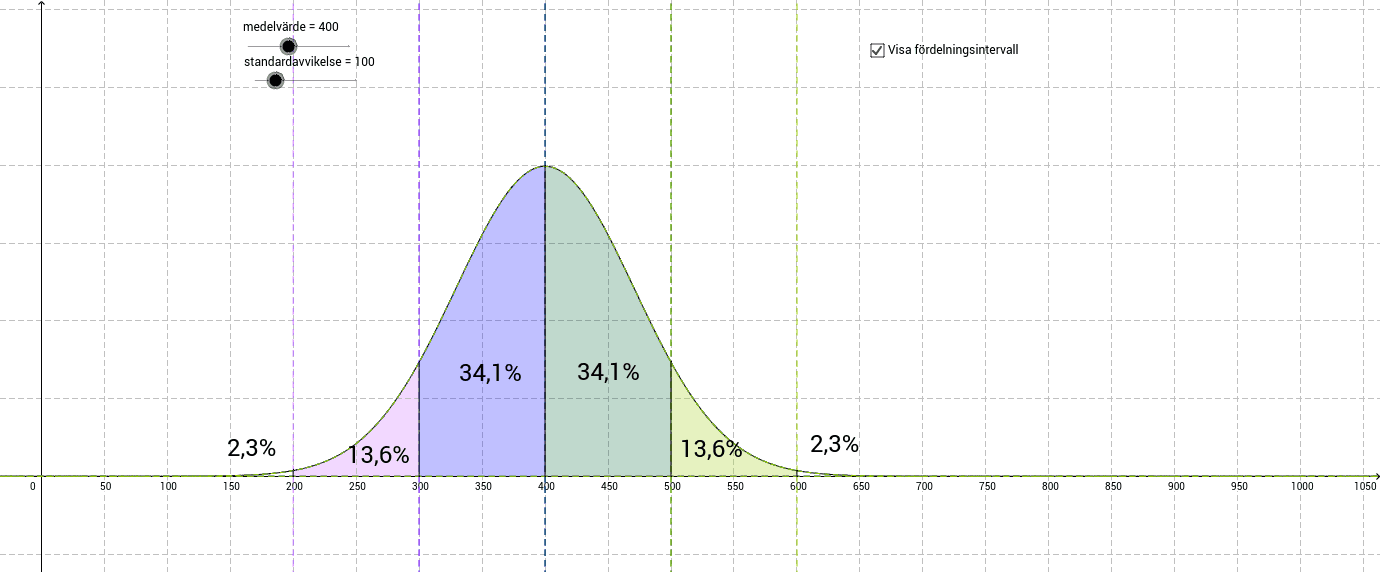
This example demonstrates the normal distribution curve and its properties, involving core concepts like normal distribution, mean, standard deviation, function graphing, and integral. It constructs the mean line, standard deviation regions, and curve using GeoGebra commands such as Intersect, Segment, and Midpoint. Suitable for high school students and statistics enthusiasts.
GeoGebra Commands & Parameters
Intersect(f, g, (200, 7.306882745280775E-4)) → AIntersect(g, xAxis) → BIntersect(f, e, (300, 0.01467626631737399)) → CIntersect(e, xAxis) → DIntersect(f, c, (500, 0.01467626631737399)) → EIntersect(c, xAxis) → FIntersect(f, d, (600, 7.306882745280775E-4)) → GIntersect(d, xAxis) → HSegment(A, B) → hSegment(C, D) → iSegment(E, F) → jSegment(G, H) → kIntersect(f, l, (400, 0.03989422804014327)) → IIntersect(l, xAxis) → JSegment(I, J) → mMidpoint(C, E) → KMidpoint(C, K) → LMidpoint(K, E) → MMidpoint(A, G) → NMidpoint(A, L) → OMidpoint(M, G) → PMidpoint(O, D) → QMidpoint(P, F) → R
AI Drawing Prompt Reference
Draw a normal distribution curve, mark the mean line and standard deviation regions, connect the curve to the x-axis with line segments, and display the midpoints and their connecting lines to illustrate the core concepts of the normal distribution, including mean, standard deviation, and integral areas, suitable for high school students and statistics enthusiasts.
The prompt above was compiled from the original drawing commands and is for reference only.