
Normal Distribution Curve Demo
Loading the math board and drawing, please wait…
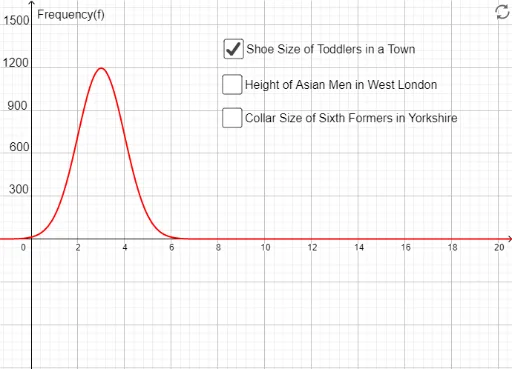
This example demonstrates the plotting and properties of the normal distribution curve. It involves core math concepts like normal distribution, coordinate geometry, quadratic equations, line segments, and plane figures. Construction highlights include using the Normal command to plot the curve, sliders a, f, g to adjust parameters, and objects b, c, d for auxiliary segments/shapes, with text1 to text6 for annotations. Suitable for high school and above learners to understand the characteristics and parameter effects of normal distribution.
GeoGebra Commands & Parameters
Normal(3, 1, x, false) → aNormal(5, 2, x, false) → fNormal(13, 3, x, false) → g