
Normal Distribution by TPettifor
Loading the math board and drawing, please wait…
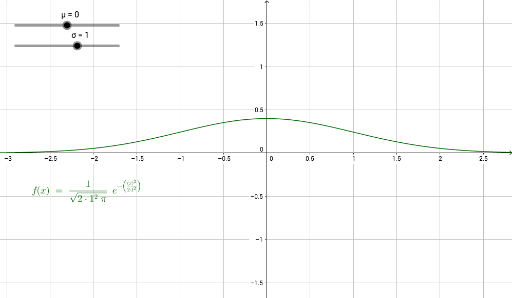
This example demonstrates the normal distribution, a continuous probability distribution characterized by a bell-shaped curve. By adjusting parameters μ (mean) and σ (standard deviation), the shape of the curve can be observed. The example uses the function object f in GeoGebra to plot the normal distribution curve. Suitable for high school mathematics education and students learning probability and statistics.
GeoGebra Commands & Parameters
Numeric σ(1)Numeric μ(0)f(x) = (1 / sqrt(((2 * σ^(2)) * π)) * ℯ^((-((x - μ)^(2) / ((2 * σ^(2)))))))
AI Drawing Prompt Reference
Draw a bell-shaped curve representing a continuous probability distribution, showing the normal distribution's characteristics with adjustable mean and standard deviation parameters to change the shape, using a function object for plotting, suitable for high school math and probability statistics education.
The prompt above was compiled from the original drawing commands and is for reference only.