
Normal Approximation to Poisson Distribution
Loading the math board and drawing, please wait…
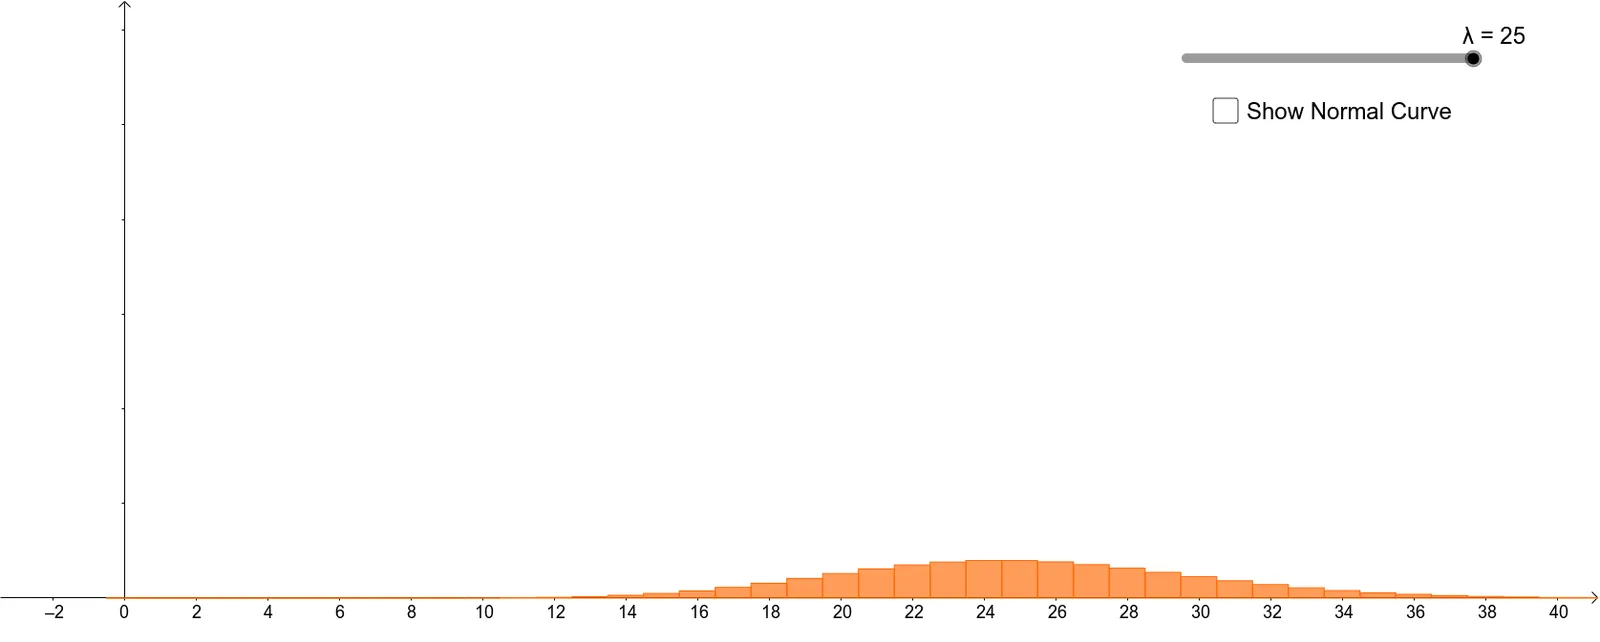
This example demonstrates the normal approximation of Poisson distribution under large sample conditions. Key mathematical concepts include probability distribution, parameter λ, standard deviation σ, and normal distribution's mean and variance. Construction involves Poisson function, Normal function, Point object, and integral calculations. Suitable for high school students learning probability statistics or mathematical modeling.
GeoGebra Commands & Parameters
Poisson(λ) → aNormal(λ, λ^(0.5), x, false) → fPoint(xAxis) → AIntegral(f, -10, x(A), true) → c
AI Drawing Prompt Reference
Draw a graph showing the normal approximation to the Poisson distribution, including both Poisson and normal curves parameterized by λ, where the normal distribution has a mean and standard deviation equal to the square root of λ. Mark a point on the x-axis and calculate the integral of the normal curve from -10 to the x-coordinate of this point, displaying the area with a different color or fill.
The prompt above was compiled from the original drawing commands and is for reference only.